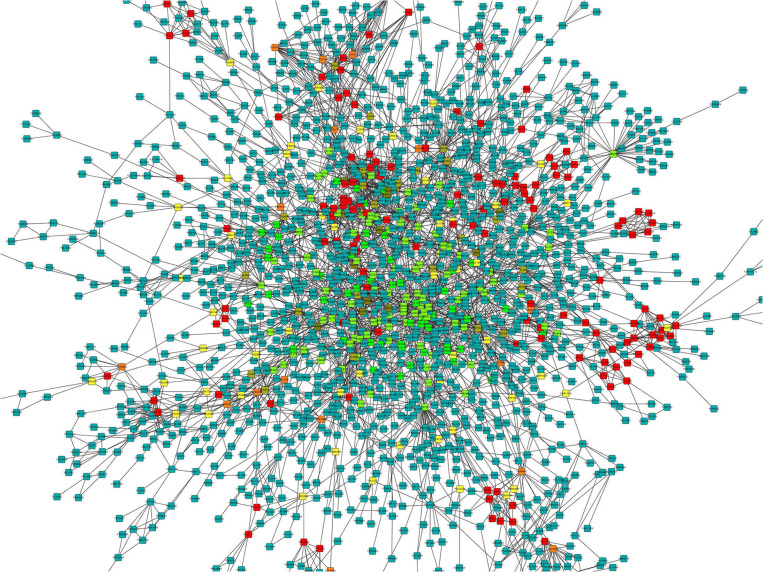
Figure 7.
Protein-protein interaction network for differentially expressed mRNAs. The color gradient is from green to red that corresponds to the value of the clustering coefficient from low to high. The clustering coefficient indicates the connectivity between the adjacent points of this node, the higher the aggregation coefficient is, the better the connectivity between the adjacent points of this node.

