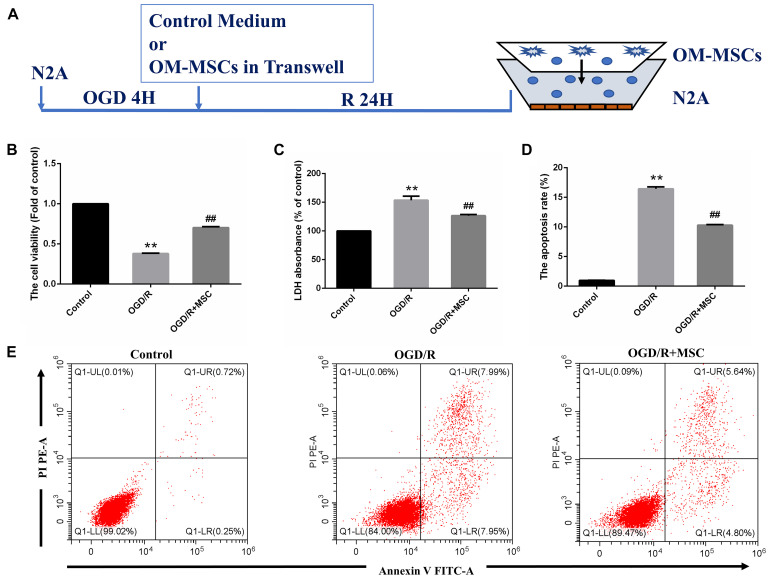
FIGURE 3.
OM-MSCs ameliorated OGD/R-induced N2a injury. (A) Schematic representation of the experimental design and the transwell system used for in vitro experiments. (B) Cell viability was determined using the CCK-8 assay, and data are normalized by control cells (the value of control cells was presented as 1.0). (C) Cell necrosis was determined using the LDH assay, and data are expressed as a percentage of the control. (D) Apoptotic cells are represented as the percentage of Annexin-V single-positive plus Annexin-V/PI double-positive cells. (E) Representative plots of FACS by Annexin V–FITC/PI dual staining. All data are displayed as mean ± SEM (n = 3). (∗∗P < 0.01 vs. control; ##P < 0.01 vs. OGD/R).

