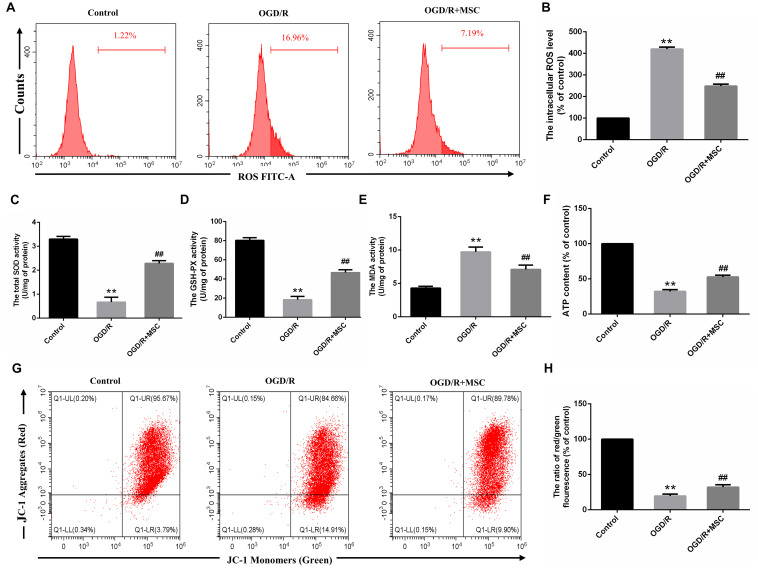
FIGURE 4.
OM-MSCs attenuated OGD/R-induced ROS overproduction and mitochondrial dysfunction in N2a cells. (A–B) Intracellular ROS levels in N2a were measured by staining with DCFH-DA, and the determination of ROS levels was carried out using a flow cytometer. (C–E) The total SOD, GSH-PX, and MDA activities in N2a were assessed. (F) The ATP content in N2a cells was assessed using an ATP assay kit, and data are expressed as a percentage of the control. (G,H) N2a was incubated with JC-1, and the determination of mitochondrial membrane potential was carried out using a flow cytometer. The mitochondrial membrane potential in each group was calculated as the ratio of red to green fluorescence. All data are displayed as mean ± SEM (n = 3). (∗∗P < 0.01 vs. control; ##P < 0.01 vs. OGD/R).

