
TABLE 4.
Results of the ANOVA two-way analysis performed between groups [orofacial pain (OFP) and healthy controls (HC)], conditions [eyes open (EO) and pain stimulation (PS)], and the interaction between group and condition, expressed as p-value and the relative F statistic in parenthesis.
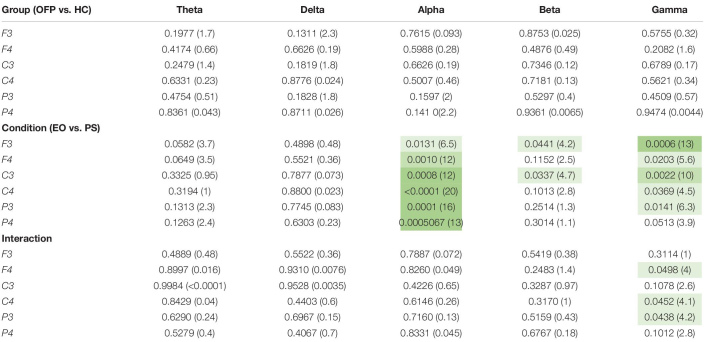 |
The three different shades of green represent three p-value threshold, specifically p < 0.05 (lightest shade), p < 0.01 and p < 0.001 (darkest shade).