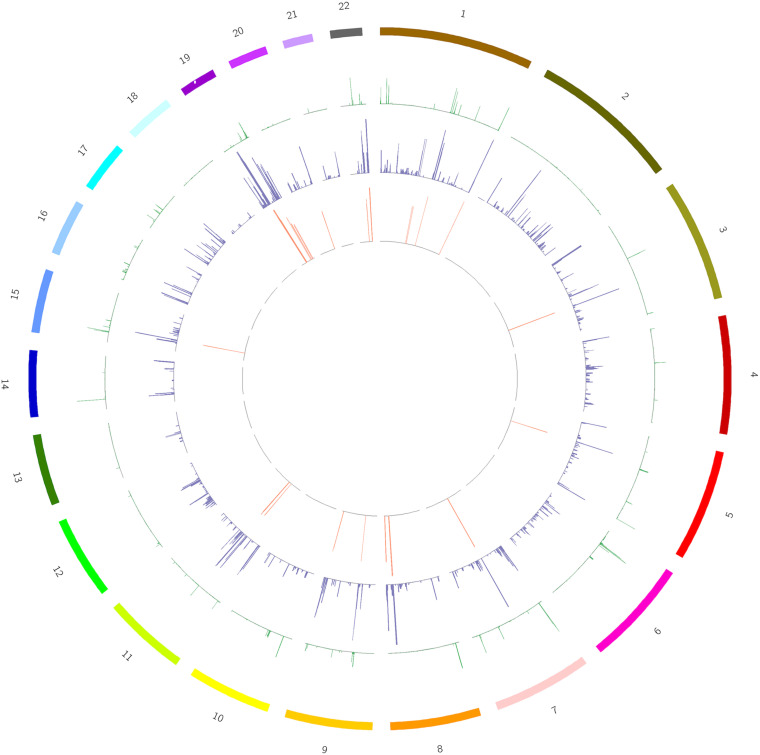
FIGURE 2.
A circos plot depicts the chromosomal distribution, gene expression and copy number variations (CNV) in case and control groups. From outside to inside: Circle 1: Chromosomes, Circle 2: CNV in the control group, Circle 3: CNV in the case group, Circle 4: 168 genes screened out. The heights of circles 2, 3, and 4 represent the proportion of samples of CNV or genes in the corresponding group (CNV samples/total samples in the group).

