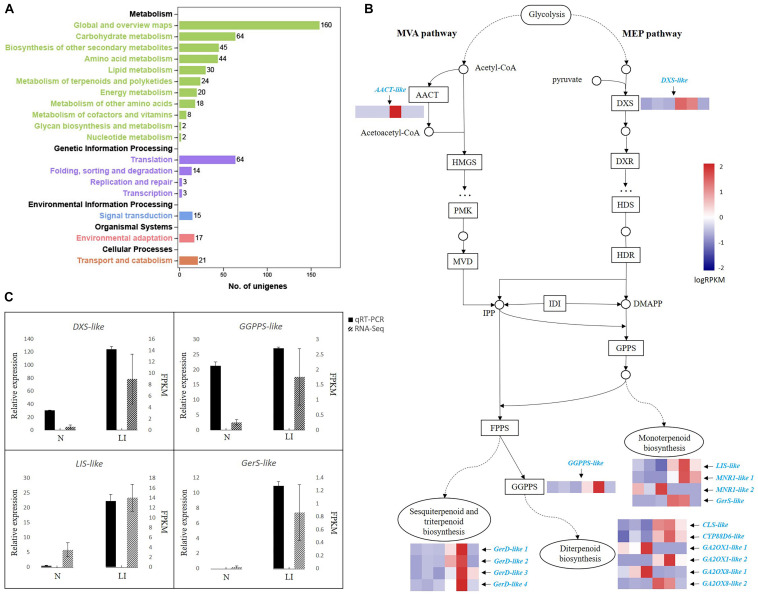
FIGURE 2.
Transcriptional cascade of DEGs in terpenoid backbone biosynthesis in linalool-type C. camphora. (A) KEGG pathway annotations of DEGs. The x-axis indicates the number of unigenes annotated in each corresponding pathway. The five categories of KEGG pathways are divided and color-coded. (B) DEGs in terpenoid backbone biosynthesis. The transcriptional cascade of terpenoid backbone biosynthesis is shown in the form of protein-coding enzymes or nodes annotated by KEGG pathway analysis. Enzyme expression patterns are indicated with logRPKM values, and DEGs are in azure. The left three and right three columns represent low oil content type (N) and linalool type (LI), respectively. AACT, acetyl-CoA C-acetyltransferase; DXS, 1-deoxy-D-xylulose-5-phosphate synthase; HMGS, hydroxymethylglutaryl-CoA synthase; PMK, phosphomevalonate kinase; MVD, mevalonate diphosphate decarboxylase; DXR, 1-deoxy-d-xylulose-5-phosphate reductoisomerase; HDS, hydroxymethylbutenyl 4-diphosphate synthase; HDR, (E)-4-hydroxy-3-methyl-but-2-enyl diphosphate reductase; IDI, isopentenyl-diphosphate delta-isomerase; GPPS, geranyl diphosphate synthase; FPPS, farnesyl pyrophosphate synthase; GGPPS, geranylgeranyl pyrophosphate synthase; LIS, linalool synthase; MNR1, (+)-neomenthol dehydrogenase-like isoform; GerS, geraniol synthase; GerD, (−)-germacrene D synthase; CLS, ent-copalyl diphosphate synthase; CYP88D6, cytochrome P450 88D6; GA2OX, Gibberellin 2-beta-dioxygenase. (C) qRT-PCR validation of RNA-Seq data. The black bars represent relative gene expression determined by qRT-PCR (left y-axis) and the dotted gray bars represent gene expression levels detected by RNA-Seq (right y-axis). Standard errors of the three technical replicates of each sample of the qRT-PCR analysis and three biological replicates in the two experimental groups of the RNA-Seq analysis are indicated by error bars.

