Figure 2.
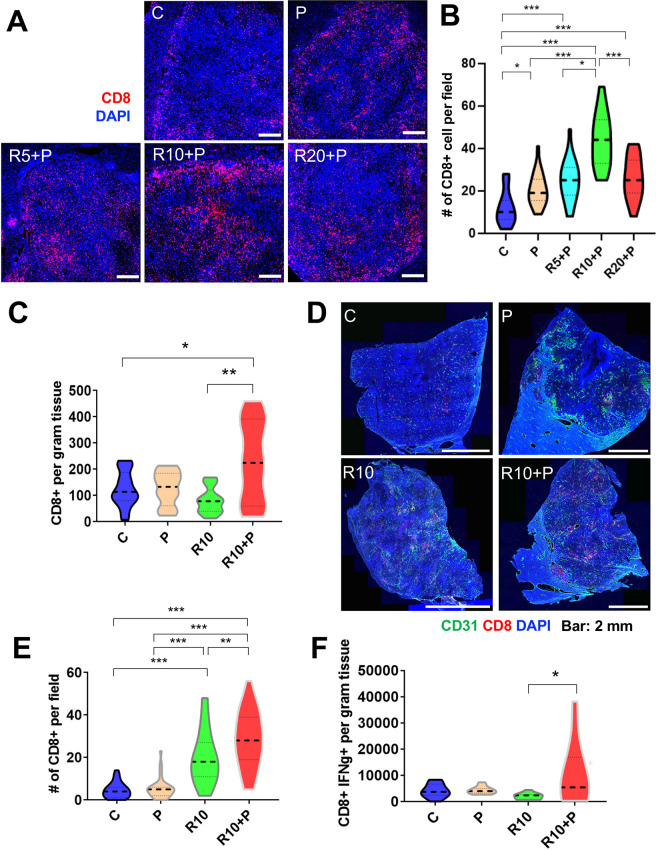
Intermediate dose of regorafenib with antiprogrammed cell death protein 1 (anti-PD1) therapy increases intratumoral CD8+ cytotoxic T lymphocyte (CTL) infiltration and activation in RIL-175 model. (A) Mice with established (4–5 mm in diameter) hepatocellular carcinomas (HCCs) were treated with anti-PD1 therapy (P) alone or in combination with 5 mg/kg (R5), 10 mg/kg (R10) or 20 mg/kg (R20) regorafenib versus control (C) (n=8 mice per group, 1 week treatment). We used immunofluorescence (IF) for evaluation of T-cell infiltration by CD8 immunostaining. Representative IF of tumor sections after staining for CD8 (for T cells in red) and DAPI counterstaining (in blue). Five random fields from the tumor center (defined as no inclusion of the edge of the tumor) were evaluated for each sample. Data represent mean values. Scale bars=500 µm. (B) Quantitative analysis of IF data showed a significant increase in CD8+ T cells after R10+ P treatment compared with all other groups. (C) Regorafenib (10 mg/kg daily, R10) combined with anti-PD-1 therapy (P) significantly increased the number of CD8+ T cells per gram RIL-175 tumor tissue measured by flow cytometry versus control or R10-treated mice (n=11–13 mice, 12 days of treatment). (D) Representative IF confocal microscopy images of CD8 T-cell distribution (in red) in whole RIL-175 tumor tissue sections; CD31 staining of vessels in green and DAPI counterstaining in blue; scale bars=2 mm. (E) Quantification of intratumoral CTL infiltration in RIL-175 HCCs showing a more substantial increase in intratumoral CTL infiltration in R10/P-treated group, which was significantly higher than each treatment alone or control (n=5 mice, 12 days of treatment, 5 random fields from the tumor center (defined as no inclusion of the edge of the tumor) per sample). (F) R10/P combination therapy significantly increased the number of CD8+ interferon gamma (IFN-γ)+CTLs per gram of RIL-175 tumor tissue measured by flow cytometry versus each treatment alone or control (n=10–13 samples, 12 days of treatment). *P<0.05; **p<0.01; ***p<0.001.

