Figure 3.
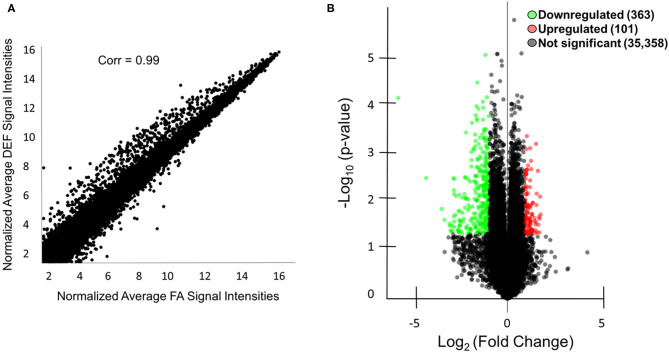
Microarray analysis of mice with and without FA. (A) A scatter plot is shown comparing the microarray data of the average normalized signal intensities for the three FA replicates vs. the average normalized signal intensities for the three deficient (DEF) replicates. The correlation coefficient was calculated using R version 3.1.0. Correlations between individual replicates within the FA group (0.99, 0.98, 0.98) and within the deficient group (0.98, 0.99, 0.98) were also calculated to show the similarities within each condition. (B) A total of 363 mRNA or lncRNA regions were downregulated (green) in the deficient condition compared to the FA condition, and a total of 101 mRNA and lncRNA regions were upregulated (red) in the same comparison as indicated by the volcano plot. An additional 35,358 mRNA and lncRNA regions were not differentially regulated (black). Genes were considered differentially regulated if they had fold change >2 and P < 0.05 by microarray analysis.

