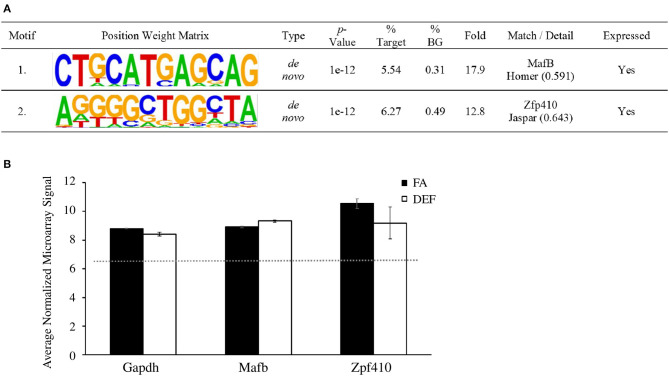
Figure 6.
Sequence motifs enriched in folate-regulated genes. (A) Differentially expressed RNA was analyzed with HOMER to determine significant transcription factors associated with differentially regulated genes. A target list of 224 sequences was compared to 19,048 background sequences. Transcription factor binding sites were mapped to be −2000 or +500 bp relative to the TSS of differentially expressed microarray genes. This table shows a list of motifs and their respective transcription factor that were enriched in the deficient condition compared to the FA condition and associated with each motif. (B) HOMER analysis showed two significantly enriched motifs that match the binding sequence for Mafb and Zfp410, respectively. The average normalized microarray levels (log2 values) for these genes are shown. Mafb and Gapdh are represented by one probe each while Zfp410 (which has three probes on the array) is represented by the probe with the highest expression level. The expression of Gapdh is a reference along with the median normalized value of all transcripts on the array (red dotted line). Error bars represent SEM values calculated from the three normalized array values prepared from three independent biological replicates.

