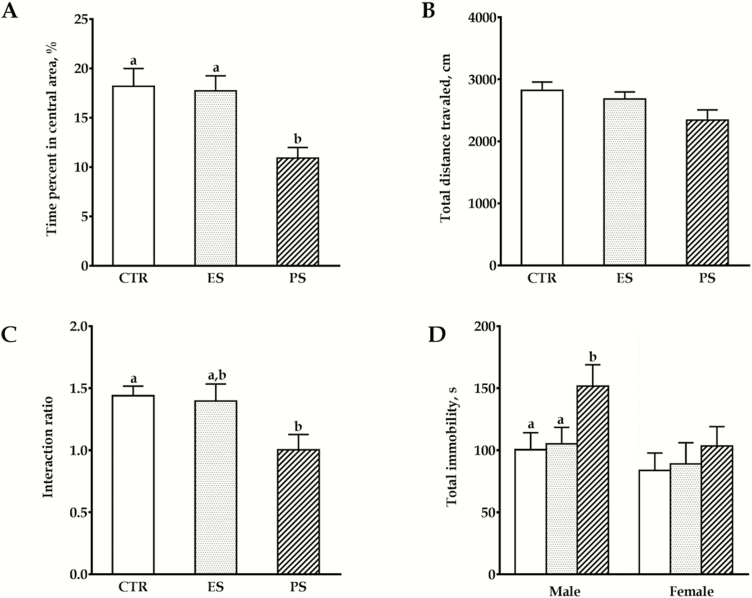
Figure 3.
Effects of physical stress (PS) or emotional stress (ES) exposure on anxiety- and despair-like behaviors. Time in the central area (A) and total distance moved (B) in the open field test (OFT). (C) Social interaction ratios in the social interaction test (SI). (D) Total immobility time in the tail suspension test (TST). Data are presented as mean ± SE; n = 22 for graph A‒C (11 males, 11 females), n = 10 for graph D in each for each sex. Groups not sharing the same letter significantly differ from each other. CTR, control.

