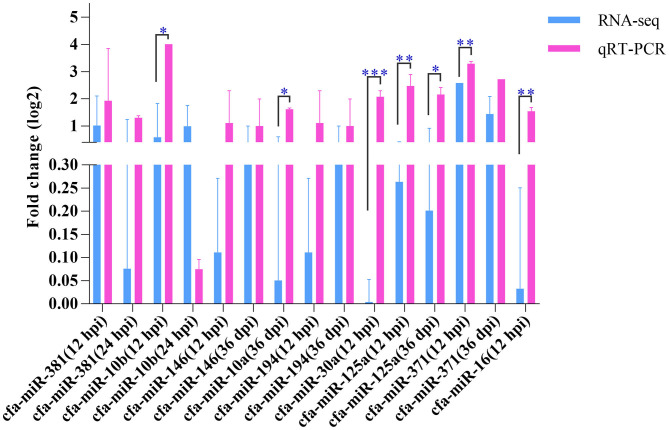
Figure 5.
Quantitative real-time PCR. The Y-axis shows the relative change of miRNA levels expressed as fold increase compared with the control U6 small nuclear RNA (snRNA). The X-axis shows the name of the nine miRNAs used in the cross-validation of expression analysis. *P < 0.05; **P < 0.01; ***P < 0.001.

