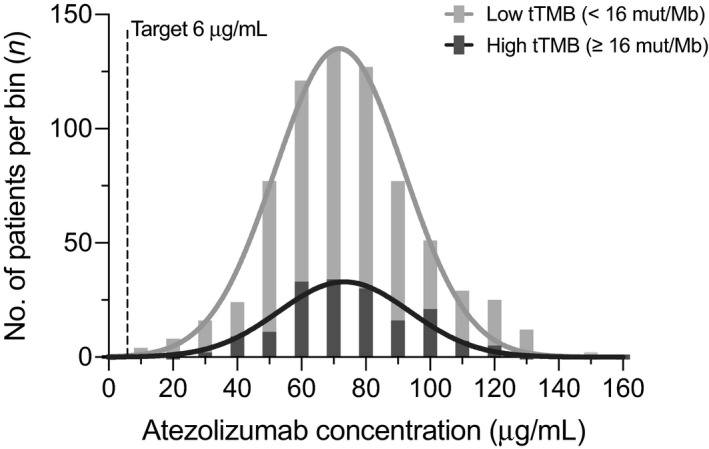
FIGURE 2.

Atezolizumab exposure distribution by tTMB status. Post hoc analysis of exposures across 880 patients treated with atezolizumab 1200 mg are shown, including 709 patients with tTMB <16 mut/Mb and 171 patients with tTMB ≥16 mut/Mb. The dotted line indicates the therapeutic target exposure of 6 µg/mL. The height of the bar represents the number of patients within that concentration range, while the width represents binning of patients from 0 to 160 µg/mL by multiples of 10. A cumulative distribution trend (dark and light grey lines) is superimposed over the frequency distribution histogram for each subgroup. tTMB, tissue tumor mutational burden
