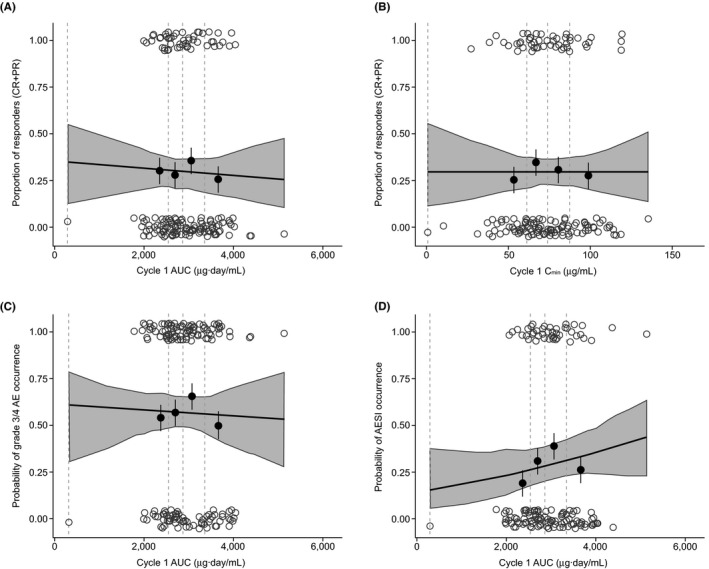
FIGURE 3.

Proportion of tTMB‐high patients who were responders (CR + PR) to atezolizumab by (A) cycle 1 AUC and (B) cycle 1 C min and the proportion of tTMB‐high patients with grade 3/4 AEs by AUC (C) and (D) any‐grade AESI by AUC. AUC and C min values for each response event (yes, 1.00; no, 0) are represented by open grey circles. Solid black circles with standard error bars: proportion of response from binned observations by quartiles of the log‐transformed exposure (y value); median exposure value within the bin (x value). Black line: model‐fitted curve of the probability of response across atezolizumab exposure. Dashed lines: binning boundaries. Shaded area: 95% confidence band for the logistic regression curve. Observed data points are based on 171 and 167 patients for efficacy and safety, respectively. AESI, adverse event of special interest; AUC, area under the curve; C min, minimum concentration; CR, complete response; PR, partial response; tTMB, tissue tumor mutational burden
