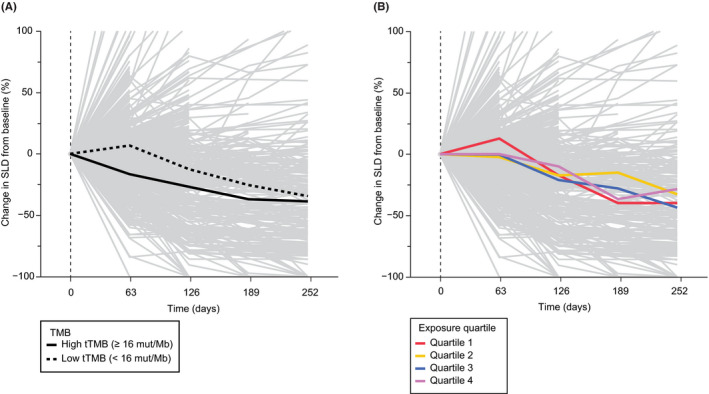
FIGURE 4.

Change in SLD from baseline by TMB status and atezolizumab exposure. (A) Tumor size change across 713 tTMB efficacy‐evaluable patients with available tumor scan data (gray). Mean changes in tumor size from baseline are represented by the solid black line for the tTMB‐high subgroup (≥16 mut/Mb; n = 145) and by the dotted black line for the tTMB‐low subgroup (<16 mut/Mb; n = 568). (B) tTMB efficacy and cycle 1 atezolizumab C min PK‐evaluable patients (n = 703). Mean tumor size changes from baseline as a function of cycle 1 atezolizumab C min exposure quartile are shown in red (n = 176), yellow (n = 176), blue (n = 176), and green (n = 175). C min, minimum concentration; PK, pharmacokinetics; SLD, sum of longest diameter; tTMB, tissue tumor mutational burden
