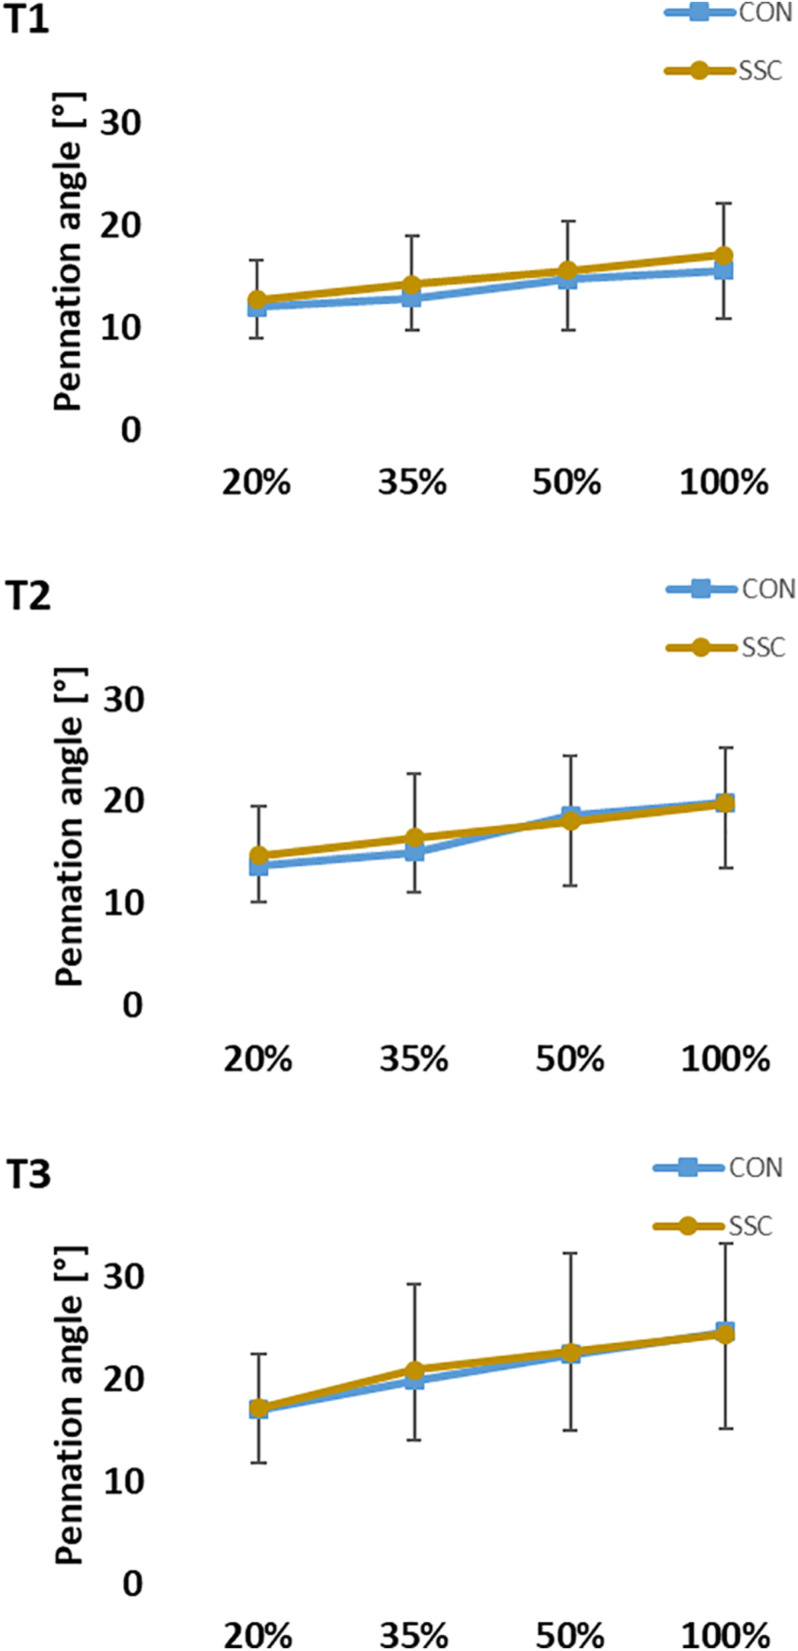
FIGURE 9.
Mean (±SD, n = 27) values of pennation angle at different contraction intensities (% of MVC). T1 is the time-point at the onset of shortening, T2 in the middle of the shortening phase, T3 the time-point at steady-state after the dynamic phase. No significant interaction (condition × intensity) was found. Main effect of condition revealed, that the pennation angle was significantly (p < 0.05) higher at the SSC compared to the CON condition at T1.

