
Figure 6.
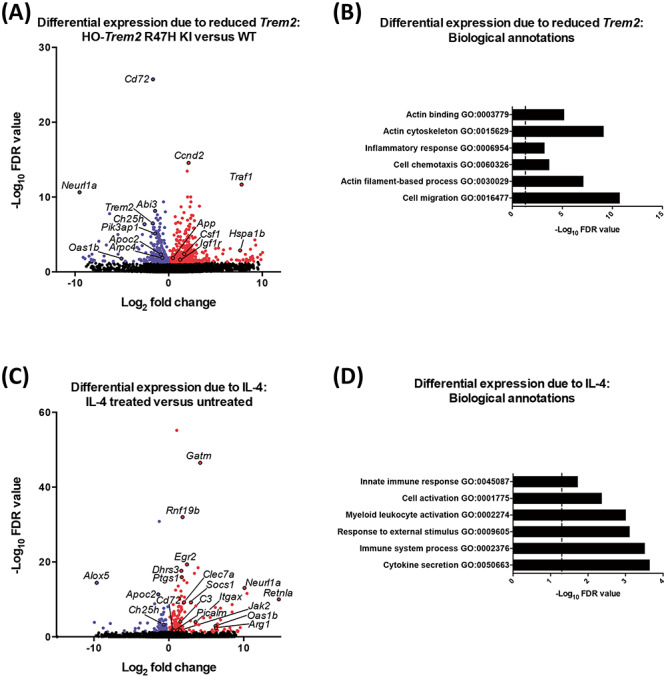
Gene expression profile in primary microglia from Trem2 R47H KI and WT mice with IL-4 treatment by RNA-seq. (A) Volcano plot showing differentially expressed genes for microglia from HO-Trem2 R47H KI versus WT mice by DESeq2 (FDR < 0.05). (B) Biological annotations associated with differentially expressed genes for microglia from HO-Trem2 R47H KI versus WT mice (FDR < 0.05) with enrichment P-values corrected for multiple testing. Vertical dashed line signifies corrected enrichment P = 0.05. (C) Volcano plot showing differentially expressed genes for microglia treated with IL-4 versus untreated by DESeq2 (FDR < 0.05). (D) Biological annotations associated with differentially expressed genes for microglia treated with IL-4 versus untreated (FDR < 0.05) with enrichment P-values corrected for multiple testing. Vertical dashed line signifies corrected enrichment P = 0.05. N = 3 mice per genotype per condition.