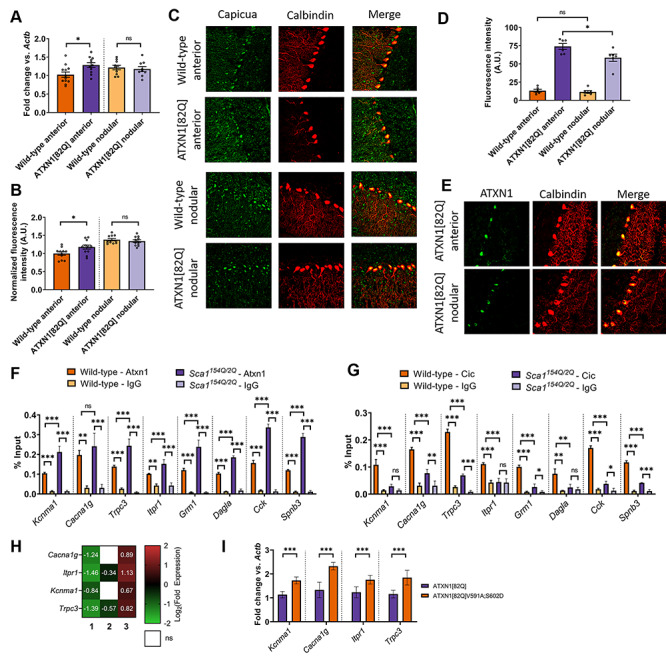
Figure 4.

Higher Cic expression in Purkinje neurons from the anterior cerebellum of SCA1 mice is associated with the repression of key ion channel genes. (A) Quantification of relative expression of Cic mRNA in the anterior cerebellum and nodular zone of ATXN1[82Q] and wild-type cerebella at P35. (B) Quantification of relative expression of Cic protein in the somata of ATXN1[82Q] and wild-type Purkinje neurons at P35, normalized to values from wild-type anterior cerebellum. (C) Representative confocal images taken from ATXN1[82Q] and wild-type Purkinje neurons at P35 after immunostaining for Cic (green) and calbindin (red, to mark Purkinje neurons). (D) Quantification of relative expression of ATXN1 protein in the somata of ATXN1[82Q] and wild-type Purkinje neurons at P35. (E) Representative confocal images taken from ATXN1[82Q] mice at P35 after immunostaining for ATXN1 (green) and calbindin (red, to mark Purkinje neurons). (F and G) qChIP demonstrating the association of Cic and Atxn1 at the promoter of SCA1-associated genes from sonicated chromatin derived from P14 whole cerebellar extracts. Binding, represented as % input (y-axis) demonstrated for Atxn1 (F) and Cic (G) comparing their relative binding on SCA1-associated genes in Atxn1154Q/2Q mice and wild-type controls and binding over background relative to their respective isotype control IgG (rabbit IgG). (H) Log2 transformation of fold change expression demonstrating the role for the ATXN1-Cic complex in the dysregulation of Cacna1g, Itpr1, Kcnma1 and Trpc3. Each column represents a distinct comparison (numbered by column): 1. ATXN1[82Q] relative to wild-type; 2. ATXN1[82Q]V591A;S602D relative to wild-type and 3. ATXN1[82Q]V591A;S602D relative to ATXN1[82Q]. (I) qRT-PCR for Kcnma1, Cacna1g, Itpr1 and Trpc3 from ATXN1[82Q]V591A;S602D and ATXN1[82Q] cerebella. *Denotes P < 0.05; **denotes P < 0.01; ***denotes P < 0.001; ns denotes P > 0.05; two-tailed Student’s t-test (A and C); two tailed-Student’s t-test with Holm-Sidak correction for multiple comparisons (D–I).
