FIGURE 2.
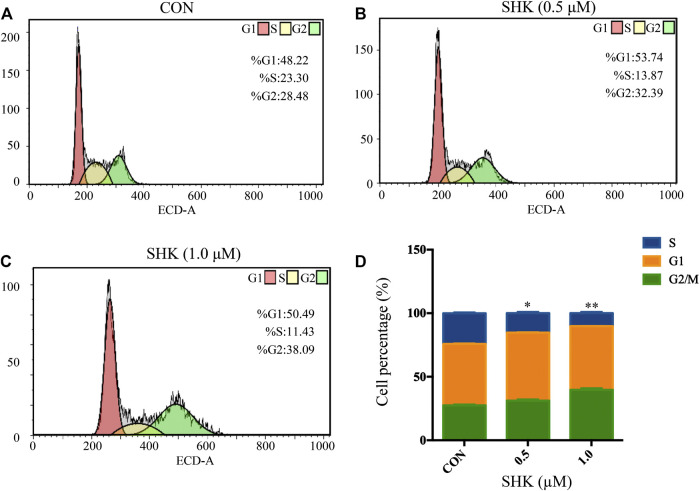
Shikonin-induced cell cycle arrest in SW620 cells. (A–C) SW620 cells were treated with shikonin at 0, 0.5, and 1.0 μM for 48 h. Propidium iodide staining and flow cytometry analysis were used to illustrate the distribution of each phase. (D) Representative percentage of each cell cycle phase for SW620 cells after exposure to shikonin. Data are expressed as mean ± SD, n = 3 (*p < 0.05 and **p < 0.01), compared with control group.

