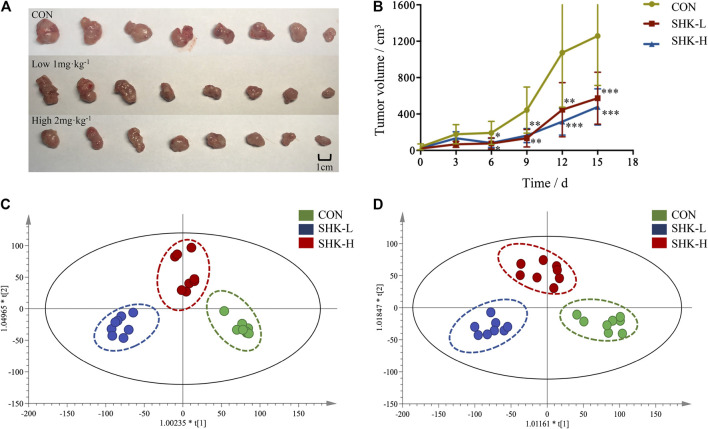
FIGURE 8.
Antitumor activity of shikonin in the xenograft mouse model. (A) Photograph of the tumor volume in three groups. (B) Tumor inhibitory rate of shikonin in nude mice (, n = 8). *p < 0.05, **p < 0.01, ***p < 0.001 vs. control group only. (C) Score plot of OPLS-DA in positive mode from tumor tissue metabolomics data. (D) Score plot of OPLS-DA in negative mode from tumor tissue metabolomics data.

