
Fig. 3.
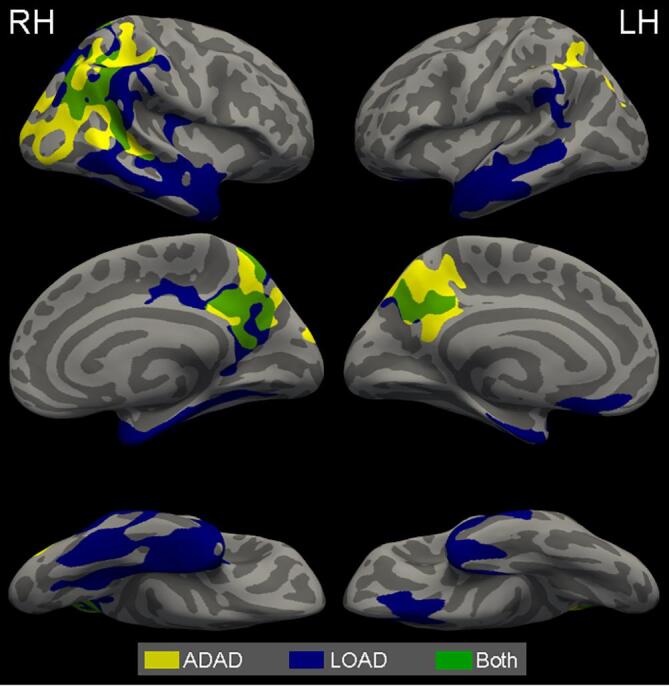
A comparison of the ADAD and LOAD optimal cortical signatures. Yellow indicates ADAD areas, blue indicates LOAD areas, and green indicates areas where both ADAD and LOAD cortical signatures overlap. Much of the overlap between the two signatures are in parts of the precuneus and parietal regions. (For interpretation of the references to colour in this figure legend, the reader is referred to the web version of this article.)