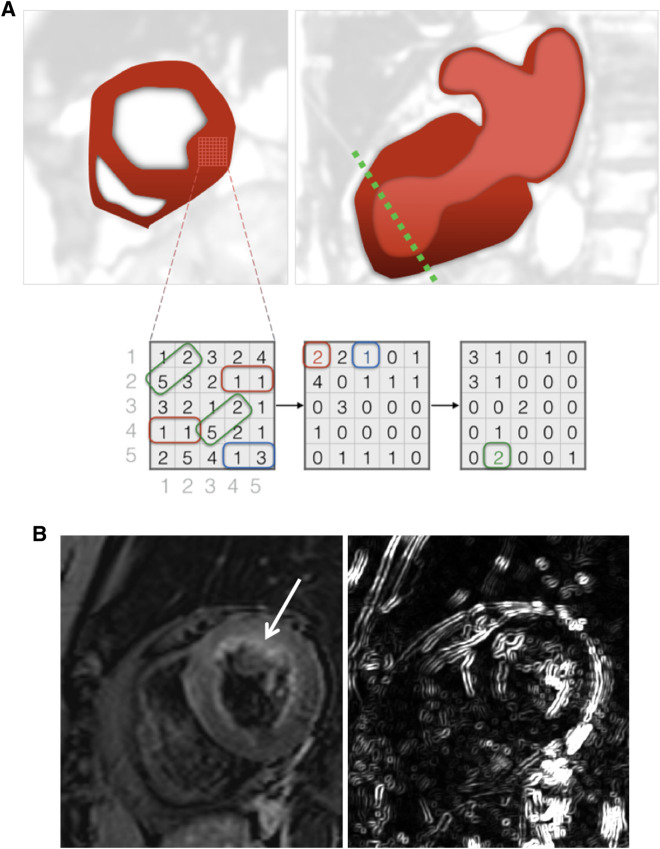
Figure 1.
Cardiac Magnetic Resonance Imaging and Texture Analysis. (A) Schematic depiction of acute takotsubo syndrome with characteristic ballooning of the left ventricle in two-chamber longitudinal view (top left image). The dotted line in green marks the plane for short axis cardiac magnetic resonance image acquisition (top right) at the point of maximal ventricular wall abnormality. After placement of a region-of-interest within the myocardium, a matrix of contained pixel intensities is generated (bottom left). Derived from inter-pixel relationships, various texture analysis features can be computed. Grey-Level co-occurrence matrices (GLCM) for 0° (bottom center) and 45° (bottom right) are shown. Exemplarily, the combination of two consecutive pixels with value ‘1’ is found twice in the signal intensity matrix and therefore marked as ‘2’ in the GLCM (0°) matrix at position row = 1 and colums = 1 (red box). Similarly, two consecutive pixels with value ‘1’ and ‘3’ are found once and therefore marked as ‘1’ in the GLCM (0°) matrix at position row = 1 and column = 3 (blue box). The diagonal runs of values ‘5’ and ‘2’ are found twice in the signal intensity matrix and therefore marked as ‘2’ in the GLCM (45°) matrix at position row = 5 and column = 2 (green box). (B) 76-year old female patient with acute onset of takotsubo syndrome with basal oedema (arrow) in a fat saturated T2w short axis dark-blood image of the left ventricle. Image on the right depicts the corresponding map of the GLCM S(4,-4)DifVarnc feature.

