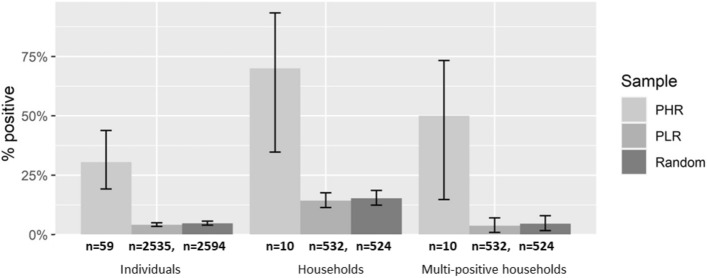
Figure 1.
Proportion of individuals that tested positive (Individuals), proportion of households with at least one positive resident (Households) and proportion of households with two or more positive residents (Multi-positive households), stratified by PHR and PLR locations. The complete sample of all houses (random) is also shown. Values listed under each column indicate the total number of individuals or households in each category.

