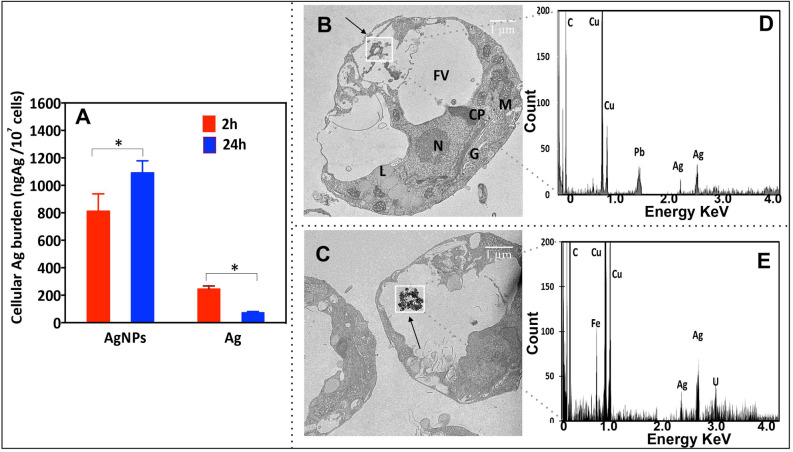
Figure 2.
(A) Ag cellular burden of P. malhamensis exposed to 1.0 mg L−1 AgNPs or 40.7 μg L−1 AgNO3 during 2 h and 24 h. The results are presented as ng of cellular Ag per 1 × 10⁷ cells. Asterisk indicates a significant difference between treatments obtained by two-way analysis of variance (ANOVA) followed by a Sidak’s multiple comparisons test (p < 0.05); (B,C) TEM images of P. malhamensis: treated with 1 mg L−1 AgNPs for 2 h (B) and for 24 h (C); (D,E) energy dispersive X-ray (EDX) spectra correspond to the interest area from C (D) and D (E). Letters on (B) denote cell organelles: G Golgi body, M mitochondrion, N nucleus, FV food vacuole, L lipid drops, CP chloroplast. *p < 0.05, **p < 0.01, ***p < 0.001.

