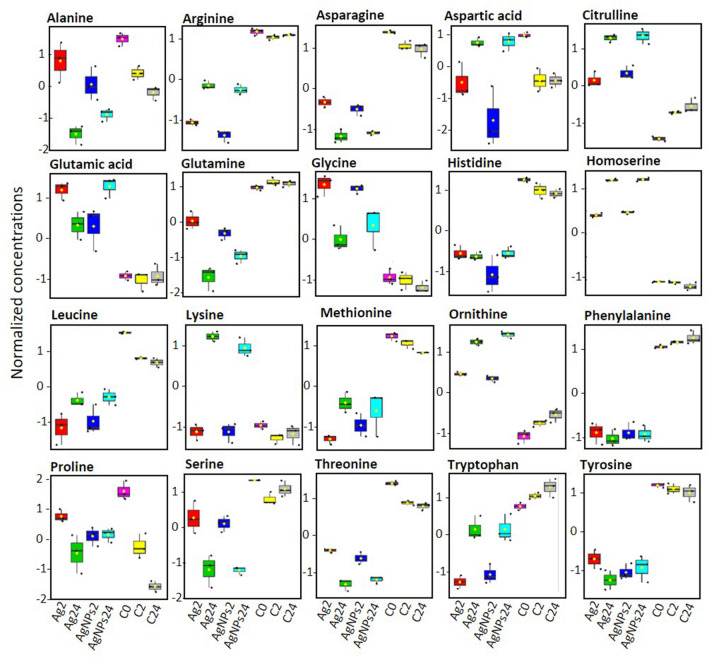
Figure 5.
Box plots of relative abundance of amino acids in P. malhamensis in Ag-treatments and untreated controls. Data were normalized by using probabilistic quotient normalization by untreated control group at time 0 (C0), log transformed and autoscaled. Exposure to 40.7 μg L−1AgNO3 for 2 h (Ag2) and 24 h (Ag24); exposure to 1 mg L−1AgNPs for 2 h (AgNPs2) and for 24 (AgNPs24); C2: unexposed controls at time 2 h; C24: unexposed controls at time 24 h.

