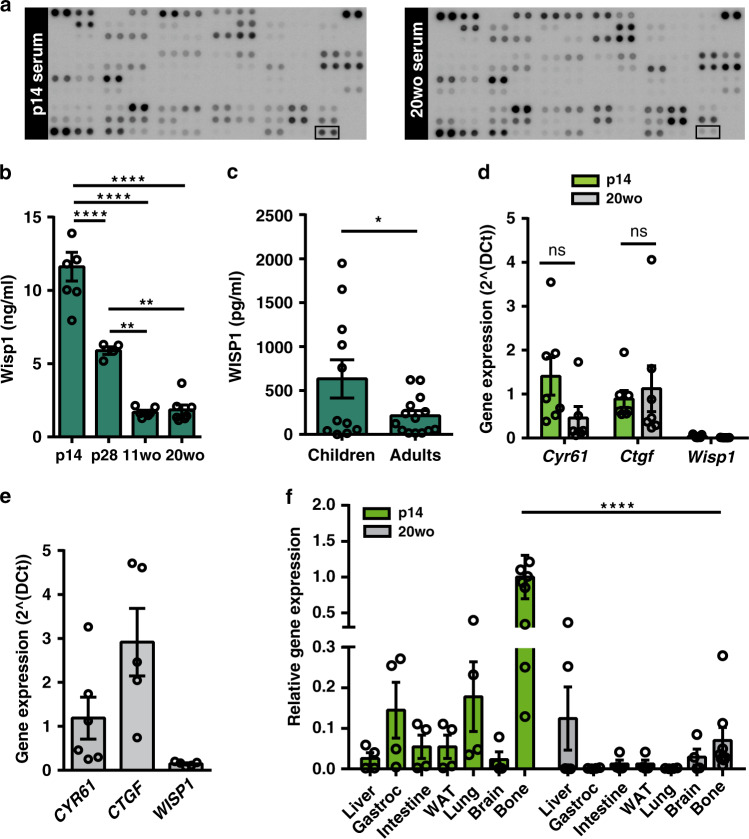
Fig. 2. Identification of Wisp1 as a factor enriched in blood of pre-weaning mice.
a Representative images of antibody arrays incubated with p14 or 20wo mouse serum. Spots corresponding to Wisp1 are marked with an empty square box. b Serum levels of Wisp1 in p14 (n = 7), p28 (n = 4), 11wo (n = 6) and 20wo (n = 7) mice measured with ELISA. c Plasma levels of WISP1 in children (n = 11) and adult (n = 14) measured with ELISA. d Quantification by qPCR of the expression of the indicated CCN genes in p14 (n = 7, green) and 20wo mouse islets (n = 6 for Cyr61, n = 7 for other genes, gray). Values are expressed relative to Tbp. e Quantification by qPCR of the expression of the indicated CCN genes in adult human islets (n = 6 for CYR61, n = 5 for other genes). Values are expressed relative to TBP. f Quantification by qPCR of Wisp1 gene expression in the indicated p14 (green) and 20wo (gray) mouse tissues. Wisp1 gene expression is shown relative to levels in p14 bone, given the value of 1 (n = 9 for bone, n = 4 for all other tissues). WAT: white adipose tissue; Gastroc: gastrocnemius. All data shown represent mean ± SEM from the indicated n. Indicated comparisons were made using two-tailed Student’s t test (c, d), one-way (b) and two-way (f) ANOVA. *p < 0.05; **p < 0.01; ****p < 0.0001; ns: not significant. In f, at p14, bone Wisp1 gene expression was significantly higher than in all other tissues tested with p < 0.01–0.001.

