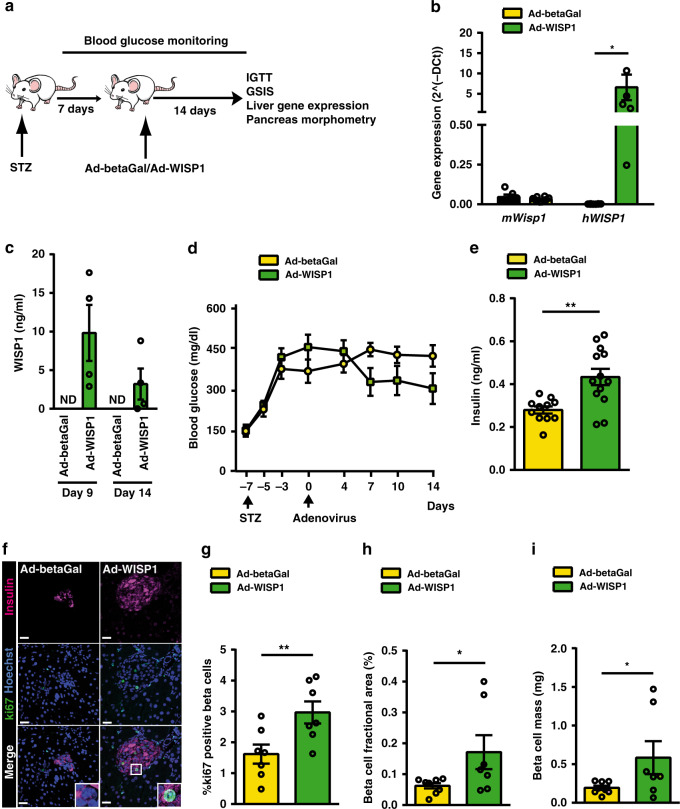
Fig. 5. Adenovirus-mediated expression of Wisp1 promotes endogenous beta cell proliferation in adult diabetic mice.
a Schematic of experimental plan. b Quantification by qPCR of mouse Wisp1 mRNA (n = 6 for Ad-betaGal, yellow; n = 10 for Ad-WISP1, green) and human WISP1 transcripts (n = 8 for Ad-betaGal, yellow; n = 6 for Ad-WISP1, green) in the livers of mice fourteen days post-injection. Expression levels are expressed relative to Tbp. c Serum human WISP1 levels were measured by ELISA at days 9 and 14 post-injection with Ad-betaGal (n = 5) or Ad-WISP1 (n = 4, green). Human WISP1 was not detectable (ND) in mice injected with Ad-betaGal. d Blood glucose concentrations measured at the indicated days post-injection with Ad-betaGal (n = 8, yellow) or Ad-WISP1 (n = 7, green). e Serum insulin at day 14 following administration of Ad-betaGal (n = 11, yellow) or Ad-WISP1 (n = 13, green). f, g Beta cell proliferation following injection of Ad-WISP1 and Ad-betaGal. f Representative images of immunofluorescence staining against ki67 (green) and insulin (purple) in fixed pancreases at day 14 after injection of the indicated adenoviruses. Nuclei are labeled with Hoechst (blue). g Percentage of beta cells (insulin+) that are ki67+ at day 14 days after injection of the indicated adenoviruses (n = 7; Ad-betaGal in yellow, Ad-WISP1 in green). h Beta cell fractional area (insulin+ area relative to total pancreatic area) and i total beta cell mass at day 14 after injection of Ad-betaGal (n = 8, yellow) or Ad-WISP1 (n = 7, green). All data shown represent mean ± SEM for the indicated n. *p < 0.05; **p < 0.01 using two-tailed Student’s t test (b, e), one-tailed Student’s t test (g–i) and two-way ANOVA (d). Scale bars are 25 μm.

