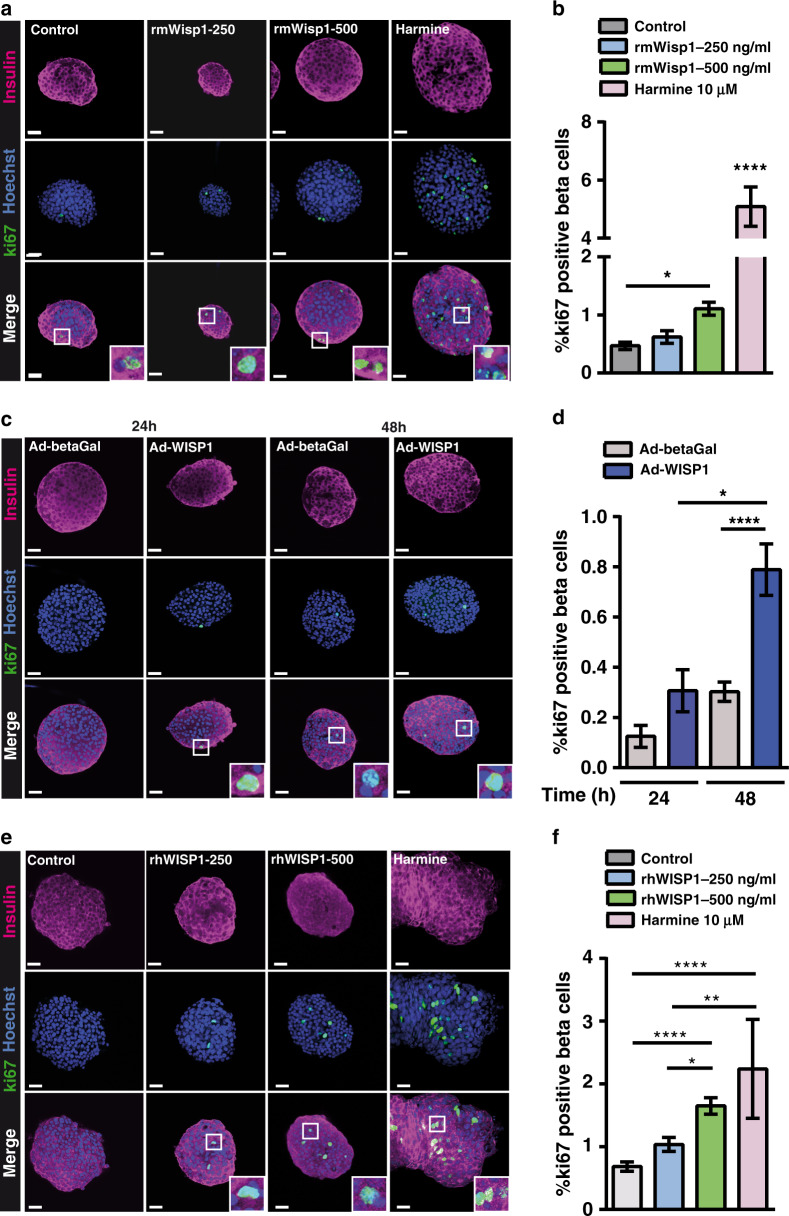
Fig. 6. Wisp1 promotes mouse beta cell replication in vitro.
a, b Beta cell proliferation in mouse islets incubated with Wisp1 recombinant mouse protein (rmWisp1). a Representative images of in toto immunofluorescence showing ki67 (green) and insulin (purple) staining in mouse islets cultured for 48 h with increasing amounts of rmWisp1 protein or harmine. Nuclei are marked with Hoechst in blue. b Percentage of beta cells (insulin+) that are ki67+ in cultured islets under the indicated conditions (control, n = 49 islets, in gray; rmWisp1-250, n = 19 islets, in blue; rmWisp1-500, n = 45 islets, in green; harmine, n = 15 islets, in pink; from four independent experiments except for harmine that are from two independent experiments). c, d Beta cell proliferation in mouse islets co-cultured with NIH3T3 cells expressing WISP1. c Representative images of in toto immunofluorescence showing ki67 (green) and insulin (purple) staining in mouse islets co-cultured for 24 or 48 h with NIH3T3 cells infected with the indicated adenoviruses. Nuclei are marked with Hoechst in blue. d Percentage of beta cells (insulin+) that are ki67+ in mouse islets cultured under the indicated conditions for 24 h (control, in gray: n = 25 islets; 3T3/WISP1, in blue: n = 21 islets, from three independent experiments) and for 48 h (control, in gray: n = 100 islets; 3T3/WISP1, in blue: n = 88 islets, from three independent experiments). e, f Beta cell proliferation in human islets incubated with recombinant human WISP1 protein (rhWISP1). e Representative images of in toto immunofluorescence showing ki67 (green) and insulin (purple) staining in human islets incubated for 48 h with increasing amounts of rhWISP1 protein or with harmine. Nuclei are marked with Hoechst in blue. f Percentage of beta cells (insulin+) that are ki67+ in human islets cultured under the indicated conditions (control, in gray: n = 79 islets; rhWISP1-250, in blue: n = 60 islets; rhWISP1-500, in green: n = 98 islets; harmine, in pink: n = 17 islets; from four donors). All data shown represent mean ± SEM for the indicated n. Comparisons were made using one-way ANOVA. *p < 0.05; **p < 0.01; ****p < 0.0001. Scale bars are 25 μm.

