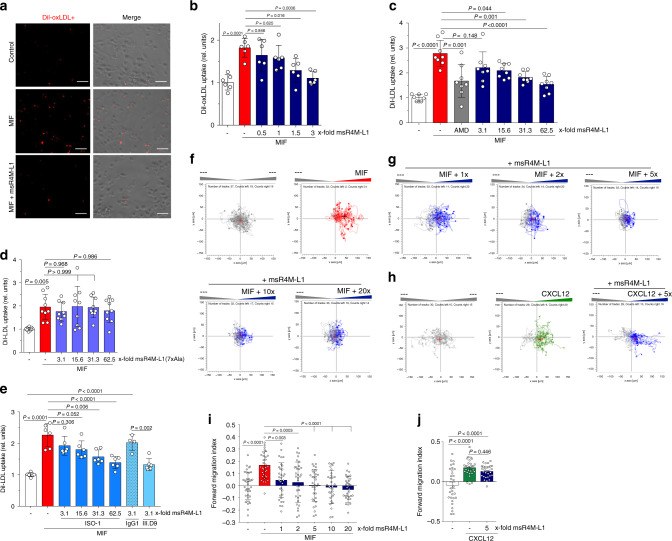
Fig. 4. msR4M-L1 specifically inhibits MIF- but not CXCL12-elicited atherogenic monocyte activities.
a, b MIF-mediated DiI-oxLDL uptake in primary human monocyte-derived macrophages is dose-dependently inhibited by msR4M-L1 (indicated as molar excess over MIF). MIF was applied at a concentration of 80 nM. a Representative images of DiI-oxLDL-positive cells; b quantification (three-times-two independent experiments; 9 fields-of-view each). c, d MIF-specific DiI-LDL uptake in primary human monocyte-derived macrophages is dose-dependently inhibited by msR4M-L1 (indicated as molar excess over MIF) (c), but not by the MIF binding-dead analog of msR4M-L1, msR4M-L1(7xAla) (d). MIF was applied at a concentration of 80 nM. Quantification (four-times-two or three-times-two plus one-time-three, respectively, independent experiments; 9 fields-of-view each). AMD3100 (AMD) was used to verify CXCR4 dependence of the MIF effect. e Same as in c, d, except that the small molecule inhibitor ISO-1 and neutralizing MIF antibody NIH/IIID.9 were used instead of msR4M-L1 (three-times-two independent experiments; 9 fields-of-view each; isotype control antibody IgG1: two-times-two). f, g Representative experiment demonstrating that msR4M-L1 inhibits MIF-elicited (red tracks) 3D chemotaxis of human monocytes as assessed by live-microscopic imaging of single-cell migration tracks in x/y direction in µm. Increasing concentrations of msR4M-L1 (blue tracks, molar excess over MIF) as indicated; unstimulated control (gray tracks) indicates random motility. i Quantification of f, g; the migration tracks of 32–37 randomly selected cells per treatment group were recorded and the forward migration index plotted; the experiment shown is one of three independent experiments with monocytes from different donors. h A 5-fold molar excess of msR4M-L1 does not affect 3D human monocyte migration elicited by CXCL12; j quantification of h; the migration tracks of 29–30 randomly selected cells per treatment group were recorded and the forward migration index plotted; the experiment shown is one of two independent experiments with monocytes from different donors. Data in b–e, i, and j are reported as means ± SD. Statistical analysis was performed with one-way ANOVA with Tukey’s multiple comparisons test or Kruskal–Wallis with Dunn’s multiple comparisons test. The scale bar in a is: 50 µm. CXCR4, CXC motif chemokine receptor-4; msR4M-L1, MIF-specific CXCR4 mimic-L1; MIF, macrophage migration-inhibitory factor. Source data are provided as a Source Data file.

