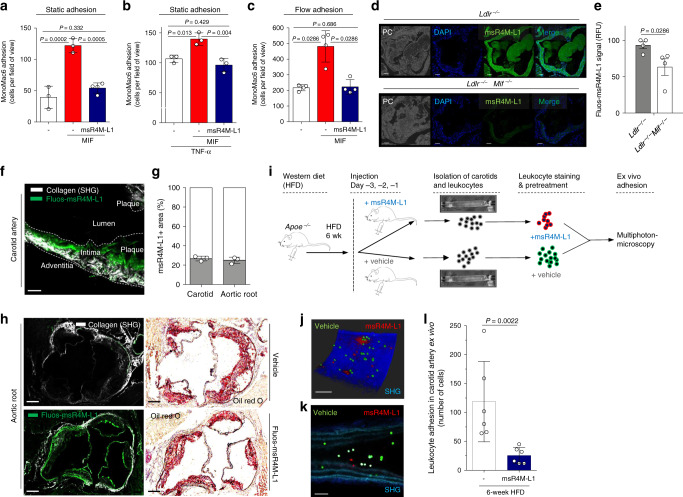
Fig. 5. msR4M-L1 localizes to atherosclerotic plaques in a MIF-specific way and inhibits atherogenic leukocyte arrest.
a, b MIF-induced static adhesion of MonoMac-6 monocytes to HAoECs is ablated by msR4M-L1. a Resting HAoECs. b As in a, except that HAoECs were pre-incubated with TNF-α. Quantification based on 3 experiments with 10 independent fields-of-view each. c MIF-induced adhesion of MonoMac-6 monocytes to HAoECs under flow conditions (1.5 dyn/cm2) is ablated by msR4M-L1. One of two independent experiments with four analyses each. d, e Fluos-msR4M-L1 stains aortic root sections from atherogenic Ldlr−/− mice on HFD in a MIF-specific manner (comparison between Ldlr−/− and Ldlr−/−Mif−/− mice). d Representative images (PC, phase contrast; DAPI, nuclei); e quantification (relative fluorescence units) from two independent experiments with two animals each indicates MIF-specific staining. f, g Multiphoton laser-scanning microscopy image (f) of a carotid artery prepared from a hyperlipidemic Apoe−/− mouse, showing that in vivo administered Fluos-msR4M-L1 localizes to atherosclerotic plaques. Vessel visualization by second harmonic generation (SHG). g Quantification of the Fluos-msR4M-L1-positive area (means of n = 3 sections) as percentage of vessel target-area. h (and g) Same as f, g, except that aortic root was prepared (green in upper panel is autofluorescence). Quantification in g indicates ORO-positive target-area. i–l msR4M-L1 inhibits leukocyte adhesion in atherogenic carotid arteries under flow as analyzed by MPM. i Schematic summarizing the ex vivo leukocyte adhesion experiment. msR4M-L1 or vehicle was injected before vessel harvest; flushed leukocytes are stained in red (msR4M-L1; CMPTX) or green (vehicle; CMFDA). j Representative image of a carotid artery showing that pre-treatment with msR4M-L1 (red) leads to reduced luminal leukocyte adhesion compared to control (green), imaged by 3D reconstruction after Z-stacking (0.8–1.5 µm) (blue: SHG). k Still image of a z sectioning video scan (single field of view) through the artery (morphology revealed by SHG: collagen, dark blue; elastin, light blue). l Quantification of 5–6 independent carotid arteries per group. Luminally-adhering cell numbers are plotted. Scale bars: d, 50 µm; f, 100 µm; h, 100 µm; j–k, 100 µm. Data in a, b, c, e, g and l are reported as means ± SD. Statistical analysis was performed with one-way ANOVA with Tukey’s multiple comparisons test or two-tailed Mann–Whitney test as appropriate. The vessel icon in Fig. 5i was used with permission from S. Karger AG (Copyright © 2006, © 2007 S. Karger AG, Basel78). msR4M-L1, MIF-specific CXCR4 mimic-L1; MIF, macrophage migration-inhibitory factor. Source data are provided as a Source Data file.

