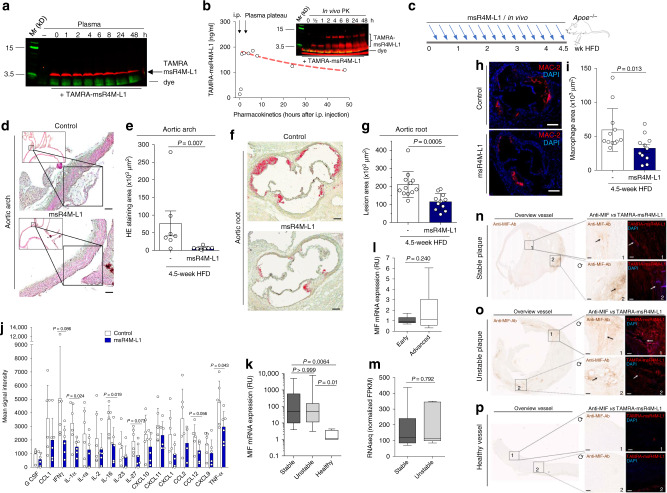
Fig. 6. msR4M-L1 inhibits atherosclerosis in vivo and msR4M-L1-based staining parallels MIF expression in human plaques.
a SDS-PAGE imaging of TAMRA-msR4M-L1 mouse plasma incubations verifies proteolytic stability (red bands, TAMRA-msR4M-L1; green, running-dye). b In vivo stability of msR4M-L1. TAMRA-msR4M-L1 i.p.-injected into C57BL/6 mice and plasma collected as indicated. The pharmacokinetic is derived from SDS-PAGE TAMRA-msR4M-L1 bands (inset) applying a TAMRA-msR4M-L1 calibration curve (Supplementary Fig. 23). c Schematic showing the in vivo injection regimen in atherogenic Apoe−/− mice. d, e msR4M-L1 treatment reduces atherosclerotic lesions in aortic arch. Representative images (d) and quantification (e) of HE-stained sections from 7 msR4M-L1- versus 7 vehicle-treated mice. f, g msR4M-L1 treatment reduces lesions in aortic root. Representative images (f) and quantification (g) of ORO-stained sections from 12 msR4M-L1- versus 12 vehicle-treated mice. h, i msR4M-L1 treatment reduces macrophage content in aortic root. Representative images (h) and quantification of macrophage area (i) of anti-MAC2-stained (red) sections from 11 msR4M-L1- versus 12 vehicle-treated mice. j msR4M-L1 reduces circulating inflammatory cytokines. Cytokine-array analysis of plasma samples from 6 msR4M-L1- versus 6 vehicle-treated Apoe−/− mice on HFD (duplicates each) (means ± SD). k–m MIF gene expression is upregulated in atherosclerotic plaques from CEA patients compared to healthy vessels but no difference between plaque stages. Expression measured with mRNA from paraffin sections (k, qPCR, n = 19 stable and 20 unstable plaques, n = 4 healthy vessels) and mRNA from fresh tissue (l, qPCR, n = 9 early, n = 9 advanced plaques; m, RNAseq, n = 6 stable and n = 5 unstable plaques). n–p Side-by-side-comparison (representative images) between anti-MIF antibody-based IHC and TAMRA-msR4M-L1 staining for selected sections of stable CEA plaques (n, n = 6 sections, 11 specimens), unstable plaques (o, n = 2 sections, 15 specimens), and healthy vessel (p, n = 2 sections, 6 specimens); (left, overviews; right, magnifications of selected areas (boxes 1, 2) stained by anti-MIF antibody (brown) and TAMRA-msR4M-L1 probe (red), DAPI + (blue); circular arrow indicates DAB-/TAMRA-stained slides are not in same orientation). Quantification of TAMRA-msR4M-L1-stained full cohorts in Supplementary Fig. 27b. Scale bars: d 50 µm; f 200 µm; h 200 µm; n–p 100 µm. Data in e, g, i, and j are reported as means ± SD; data in k–m as box-whisker plots. Statistical analysis performed with unpaired two-tailed t-test (e, g, i, j), two-tailed Mann–Whitney test, or Kruskal–Willis test (k, l, m) as appropriate. msR4M-L1, MIF-specific CXCR4 mimic-L1; MIF, macrophage migration-inhibitory factor. Source data including definitions of box-plot parameters (minima, percentiles, centers, maxima) of k–m are provided as a Source Data file.

