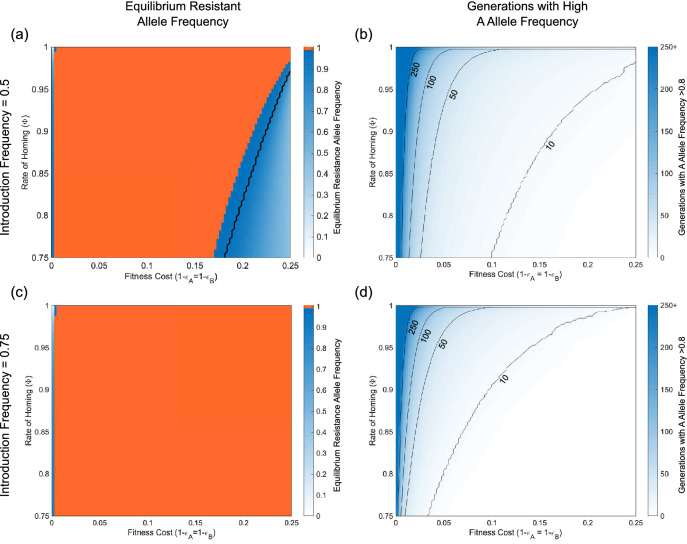
Figure 5.
NHEJ leads to the breakdown of SDKR where resistant alleles are of higher fitness than transgenic constructs. Results of numerical simulations using an initial release frequency of (a, b) 0.5 or (c, d) 0.75 over a discretised parameter grid. Here, panels (a, c) show the equilibrium resistance allele frequency (taken after 2000 generations). Orange areas represent the region in which the equilibrium resistant allele frequency equals one. Blue regions (with values shown in colour bars) denote regions in which the equilibrium resistant allele frequency was less than one. In panel (a) the region below the black line is that in which the SDKR system fails to increase above its initial release frequency. In the area between the orange region and the yellow line, the drive initially increases in frequency but is then eradicated before the resistant allele frequency has time to reach fixation. Panels (b, d) show the number of generations in which the A allele frequency is above 0.8. In each case, it is assumed that DSBs are induced in 95% of eligible target sequences with the repair mechanism being indicated by the rate of homing () in each panel. For example, a value of means repair is exclusively by HDR, whereas means that 90% of DSBs are repaired by HDR and the remaining 10% by NHEJ. Note that in each case we consider the release of individuals homozygous for both transgenic constructs and fitness costs that are applied multiplicatively.

