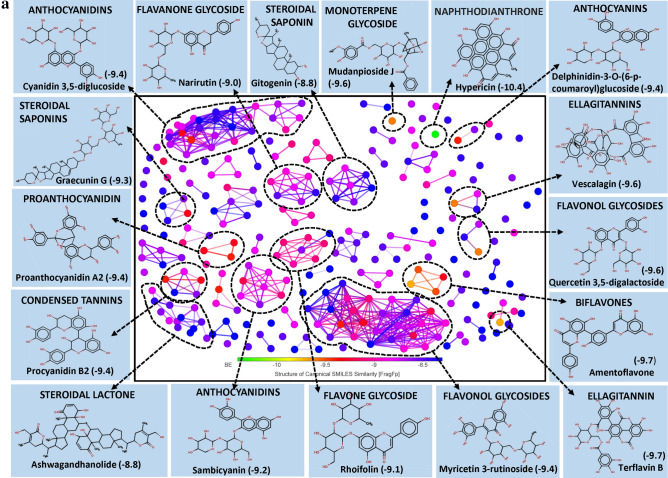
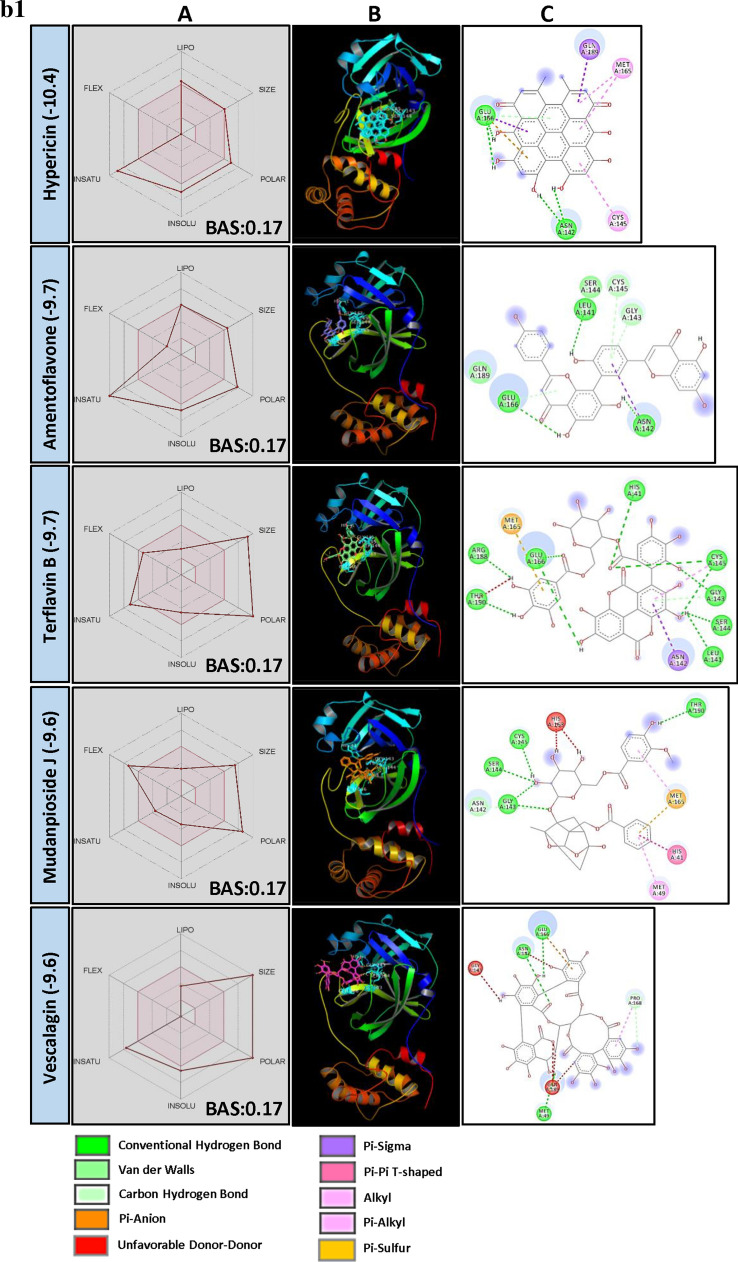
Figure 3.
(a) Structural activity relationship: Correlation of canonical SMILES structure similarity (data points are joined by colored lines) and binding energy (represented in different color shades of data point) of selected plant secondary metabolites (PSM) evaluated against SARS-CoV-2 Mpro using Data Warrior software. Structurally similar molecules are grouped in dotted lines and a representative molecule with low binding energy (kcal/mol) (values in parenthesis) is represented in box. In this case, flavonol glycosides (> 16%) and Anthocyanidine (> 16%) are the largest group of PSM among the top ranked 250 PSM. (b) Data analysis of selected PSM against SARS-CoV-2 Mpro. (A) Bioavailability radar chart representing lipophilicity (LIPO), Molecular weight (SIZE), Topological polar surface area (POLAR), Solubility (INSOLU), Flexibility (FLEX) and Saturation (INSATU) along with Bioavailability score (BAS) of selected molecules, (B) 3D visualization of protein–ligand interaction using PyMOL (selected amino acid residue of target site of protein are colored in cyan, and (C) 2D visualization of different types of interactions between ligand and target site of protein using Discovery Studio software (different types of interactions are represented in color codes).


