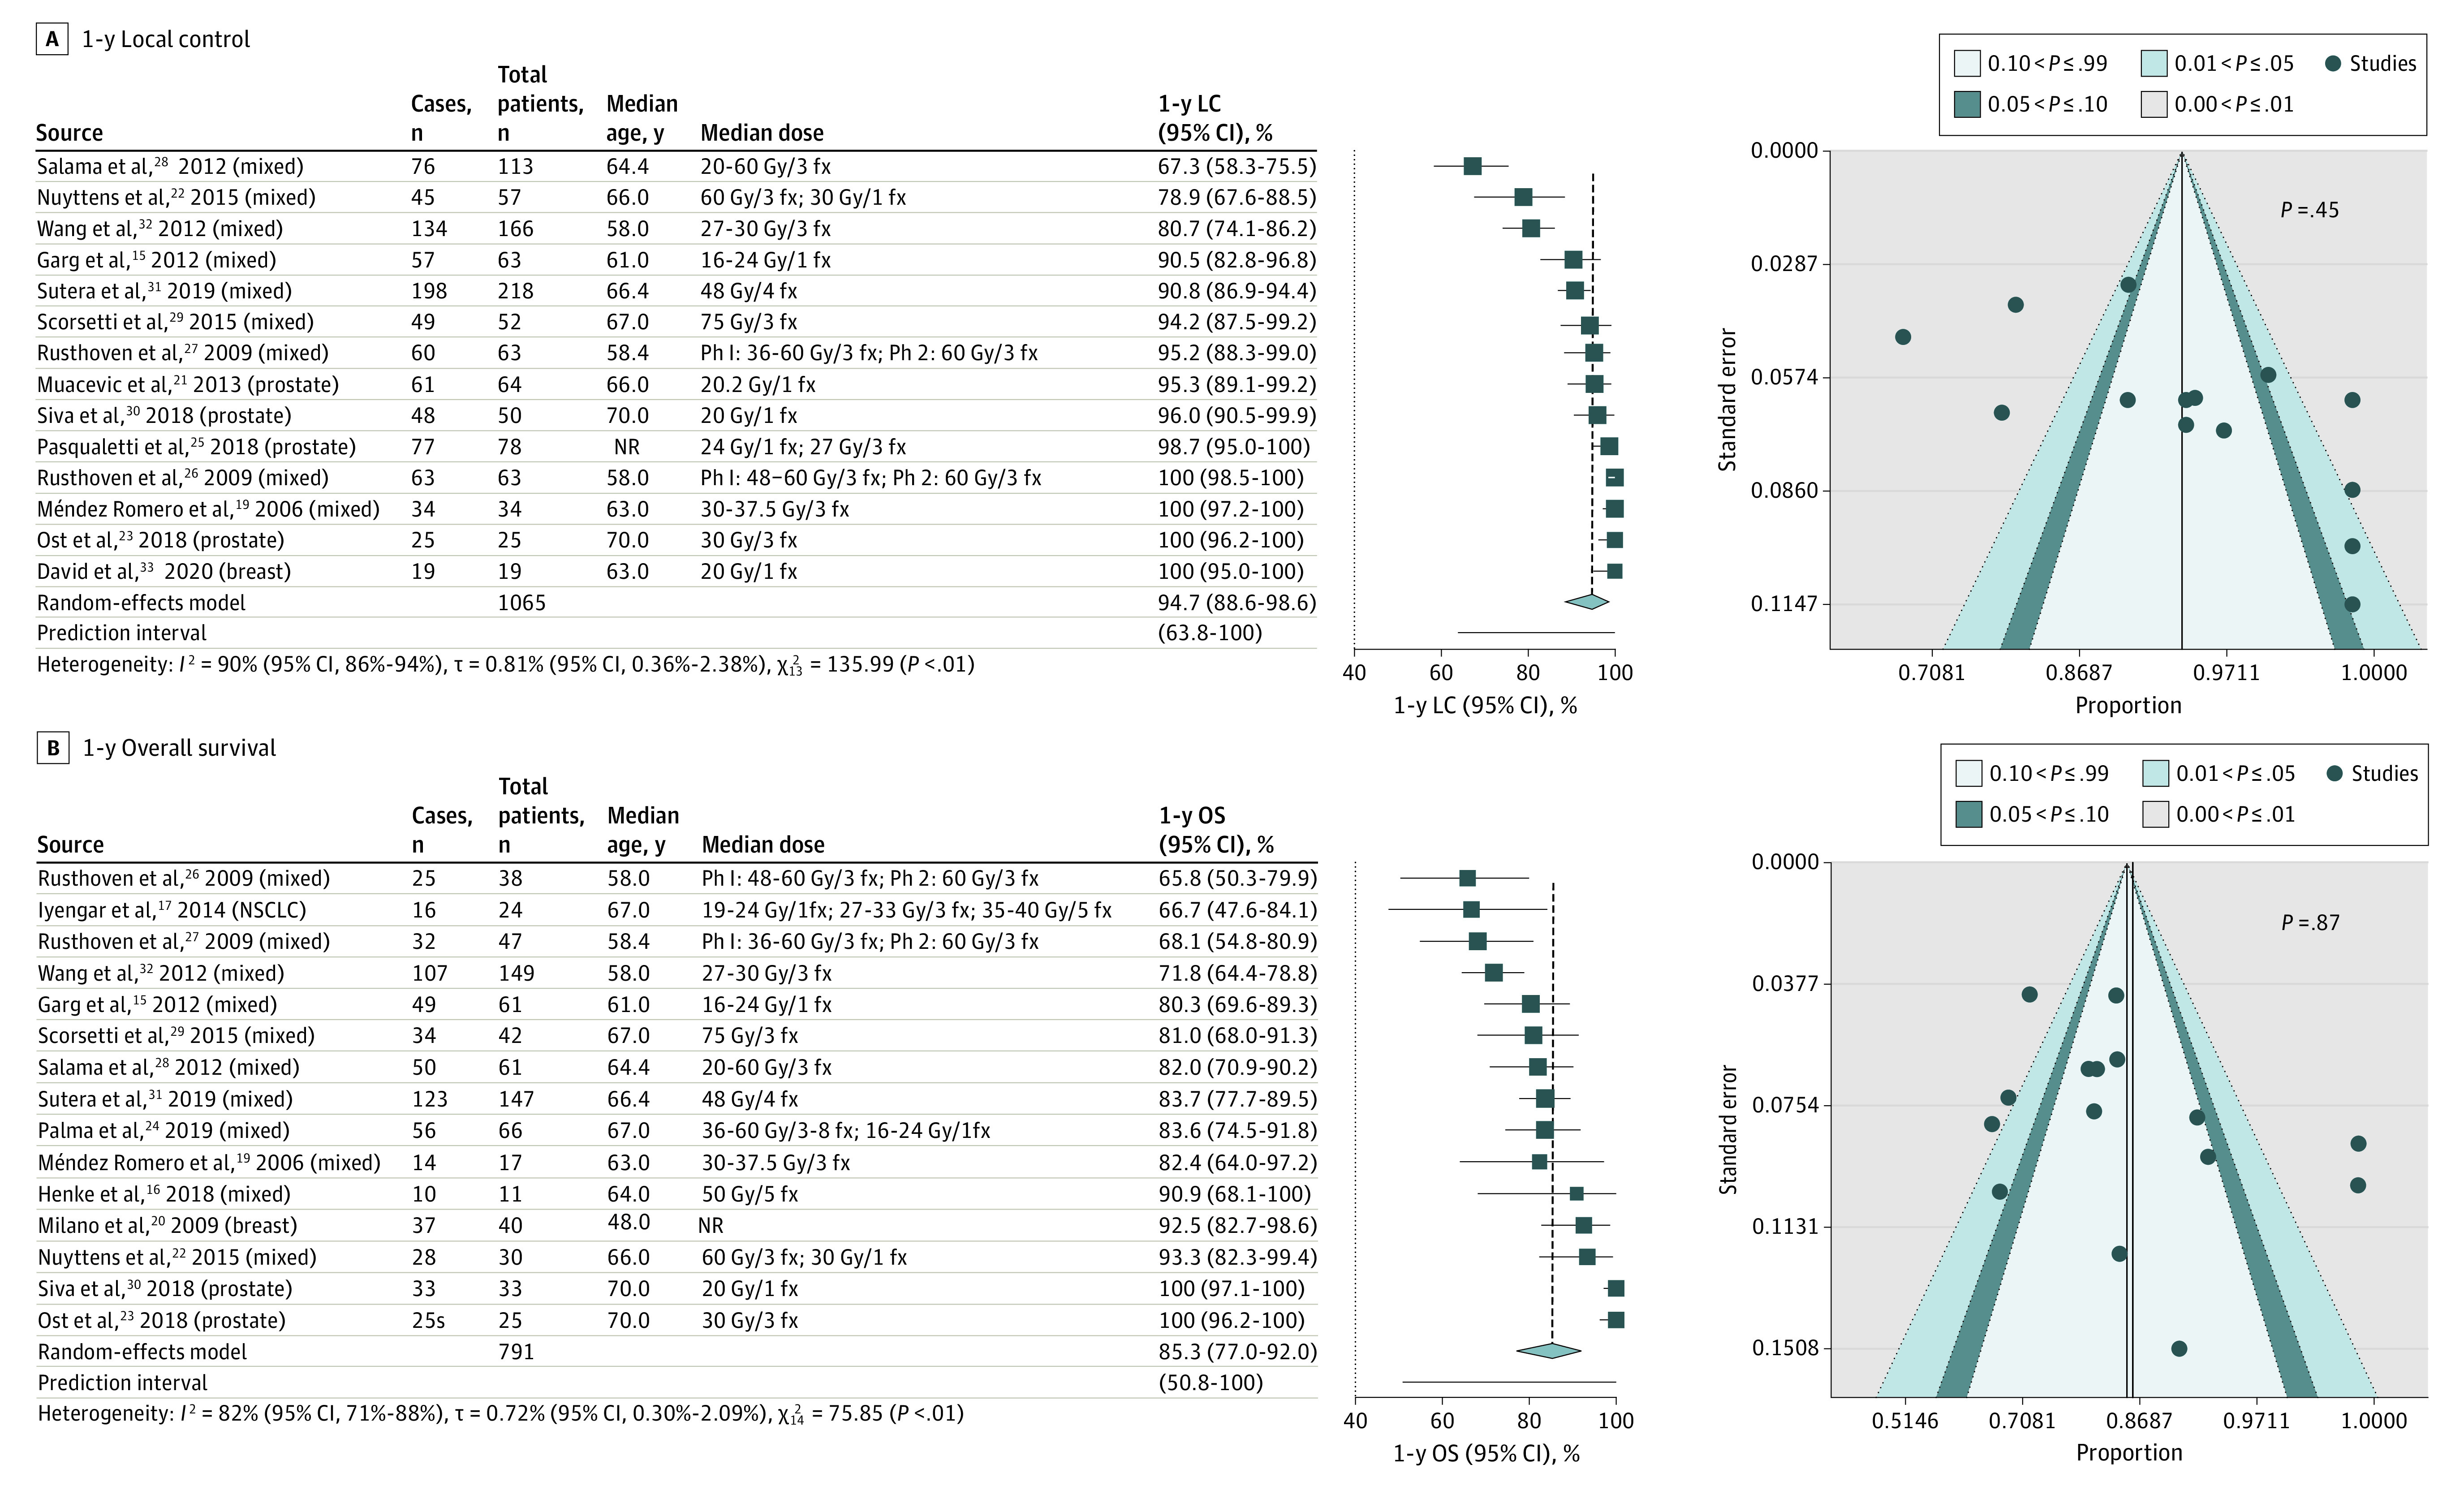
Figure 3. Clinical Benefit.

A, Weighted random-effects model depicting 1-year local control (LC) for 13 studies. In the 1-year LC funnel plot, each blue circle represents 1 of the 13 included studies, with the study effect size proportions on the x-axis and corresponding SE on the y-axis. Publication bias was not detected with P = .45 for the weighted linear regression test. B, Weighted random-effects model depicting 1-year overall survival (OS) for 15 studies. In the 1-year OS funnel plot, each blue circle represents 1 of the 15 included studies, with the study effect size proportions on the x-axis and corresponding SE on the y-axis. Publication bias was not detected with P = .87 for the weighted linear regression test. The number of cases in each forest plot was rounded to the nearest whole number. fx indicates fraction; NR, not reported; NSCLC, non–small cell lung cancer; and Ph, phase.
