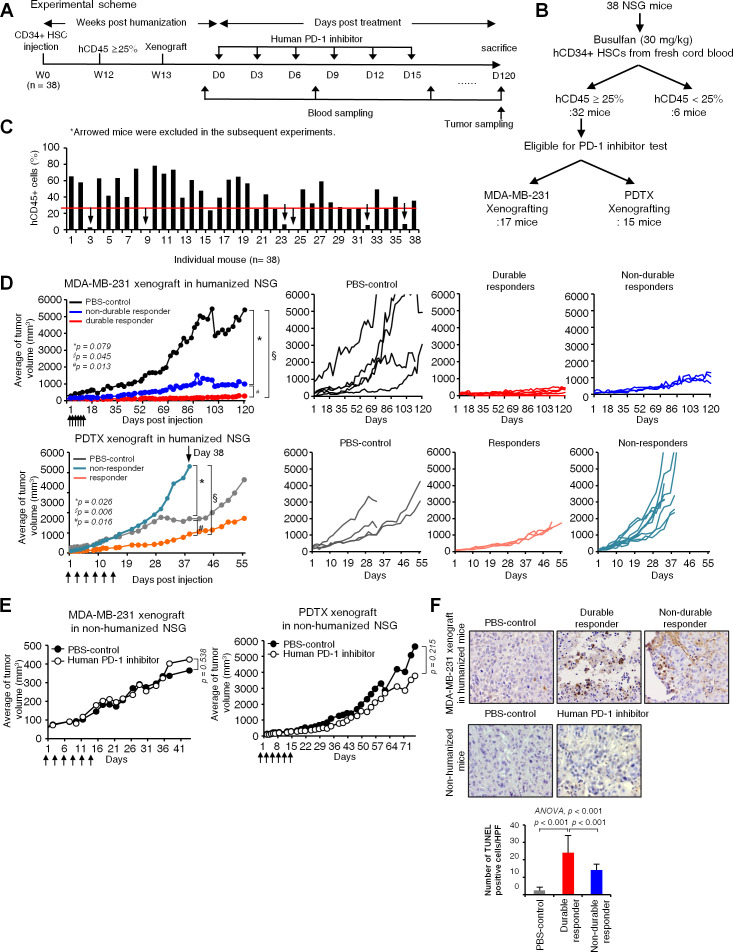
Figure 3.
Long-term antitumor efficacy of the programmed cell death-1 (PD-1) inhibitor in the MDA-MB-231 cell xenograft humanized mouse model. (A) Scheme of the PD-1 inhibitor test set. Humanized mice were generated by injecting hCD34+ hematopoietic stem cells (HSCs) in mice, myeloablated with busulfan. MDA-MB-231 cells were xenografted 12 weeks after the injection of hCD34+ HSCs. When tumors reached 50–100 mm3, the PD-1 inhibitor was administered six times every 3 days. Tumor size was monitored up to 120 days from PD-1 inhibitor treatment, and blood and tumor samples were collected at indicated time points. (B) Schematic flow diagram of humanization experiment for PD-1 inhibitor test. Thirty-eight NOD-scid IL2rγnull (NSG) mice were myeloablated by busulfan and engrafted with CD34+ HSCs isolated from fresh cord blood. Only 32 mice that fulfilled the humanization criteria (hCD45+ cells ≥ 25%) were selected for the subsequent experiments regarding the PD-1 inhibitor efficacy. (C) Demonstration of the level of hCD45+ cells (Y-axis) in individual mouse (X-axis; 38 mice). Six arrows indicate mice which did not fulfill humanization criteria. The humanization success rate was 84.2% (32/38). (D) In vivo efficacy test of the PD-1 inhibitor in the humanized mouse model. The average tumor growth inhibition curves of all mice in each group were drawn first. Then, the tumor growth inhibition curves of individual mice were drawn as durable responders versus non-durable responders of MDA-MB-231 xenografted mice, and responders versus non-responders of patient-derived tumor xenograft (PDTX) xenografted mice. P values were calculated by Student’s t-test. (E) In vivo efficacy test of the PD-1 inhibitor in the NSG mouse model without humanization. PD-1 inhibitors showed no significant anticancer efficacy in either the MDA-MB-231 xenograft or PDTX xenograft non-humanized NSG mice. P values were calculated by Student’s t-test. (F) Terminal deoxynucleotidyl transferase dUTP nick end labeling (TUNEL) assay using tumor sections at sacrifice. Representative images in each group are shown and bar graphs represent average numbers of apoptotic cells in each group in five random, non-overlapped fields at ×400 magnification. Data are presented as mean±SD. Apoptotic cells were increased in durable responders compared with PBS-treatment controls or non-durable responders. Non-humanized mouse tumor tissues were used for negative control. P values were calculated by analysis of variance test (post-hoc p values; LSD).

