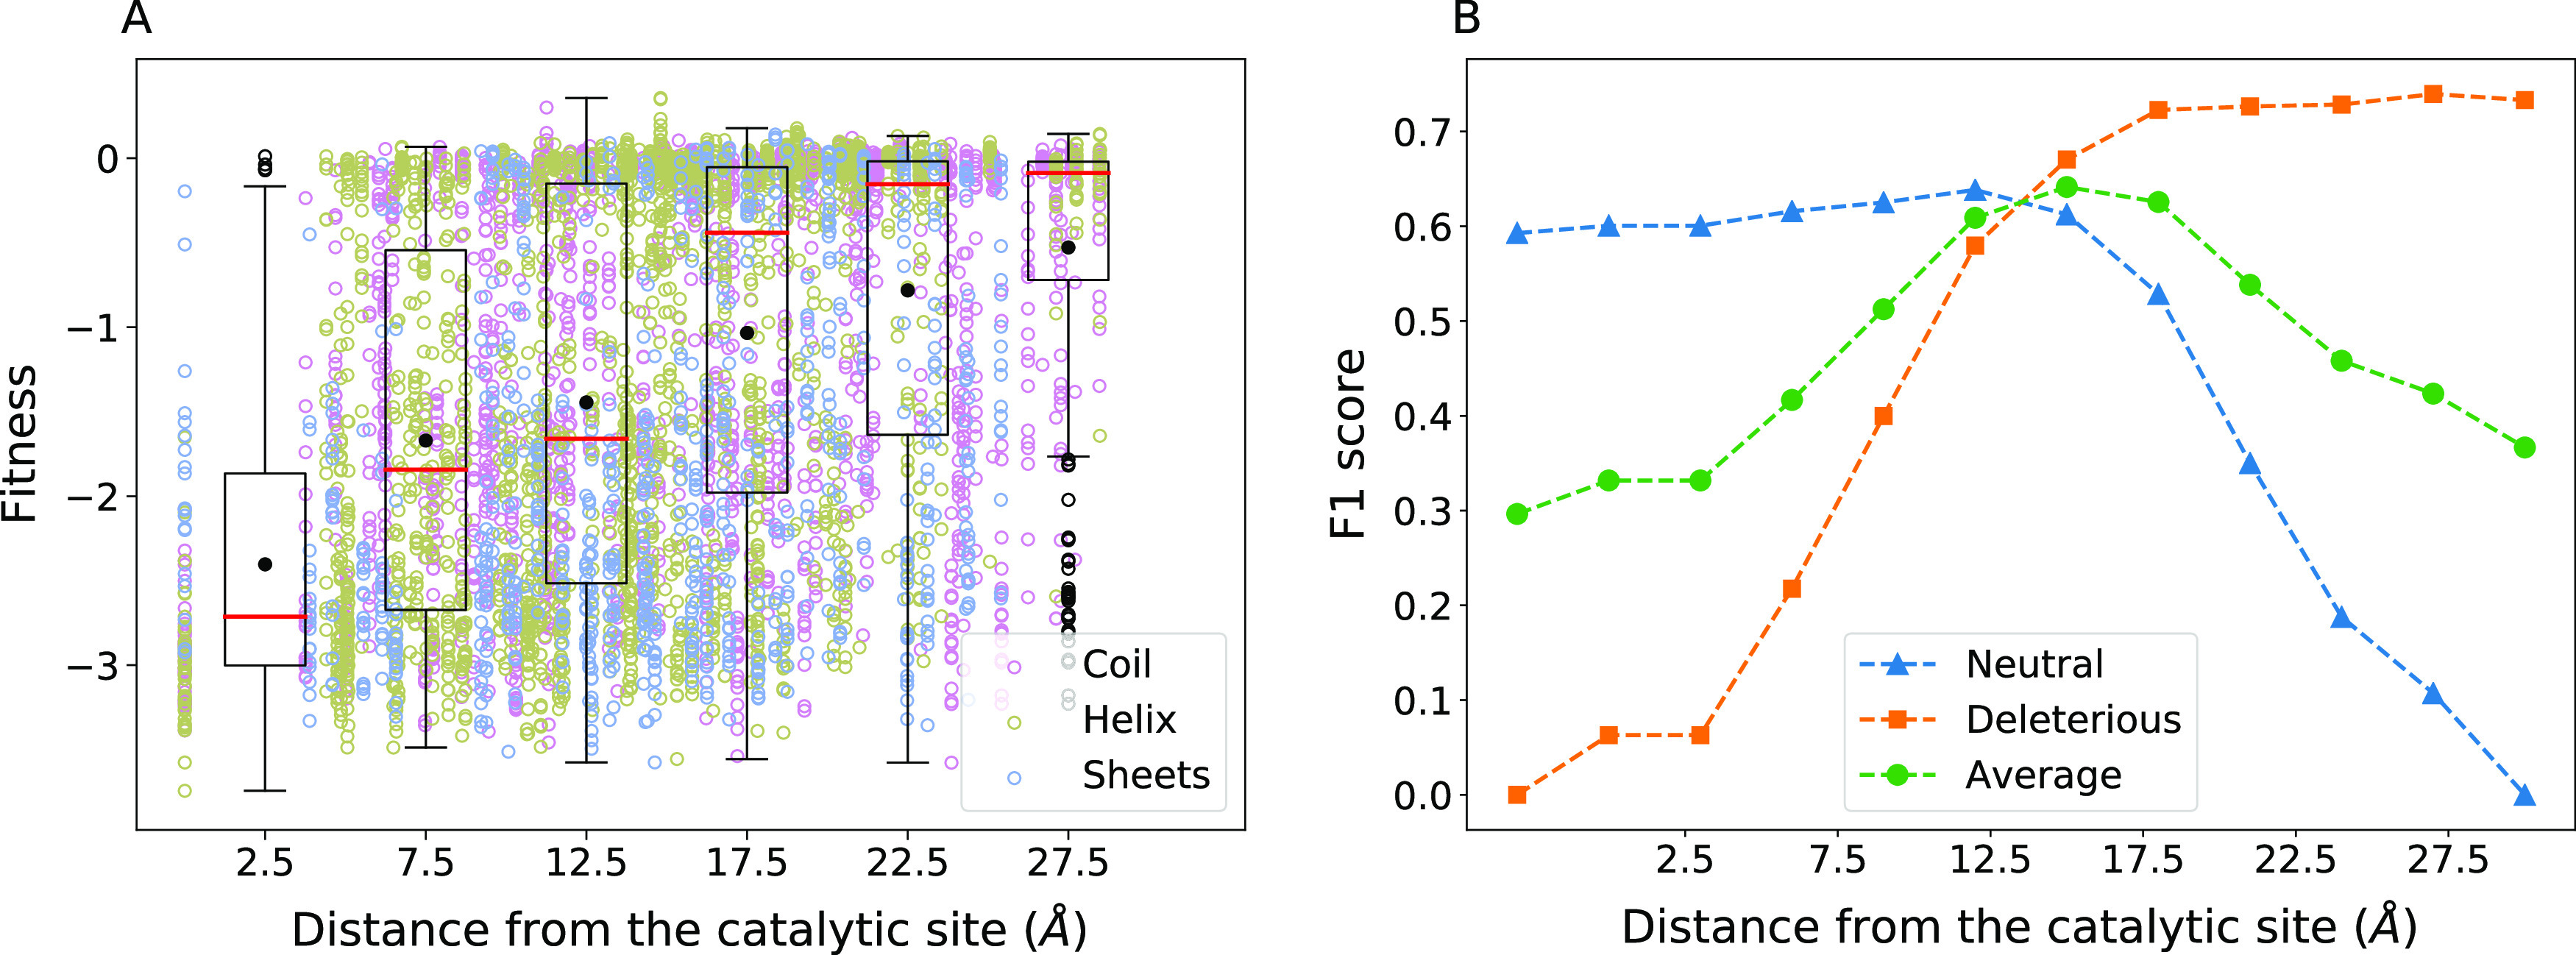
Figure 5.

Effect of distance from the catalytic site. (A) Fitness changes are shown with respect to the distance between the wild-type residue and the closest catalytic residue. See Figure 1 for details about the box-plot representation. (B) F1 score for the neutral, deleterious classes, and the average of both are plotted as the classification threshold for distance from the catalytic site is varied.
