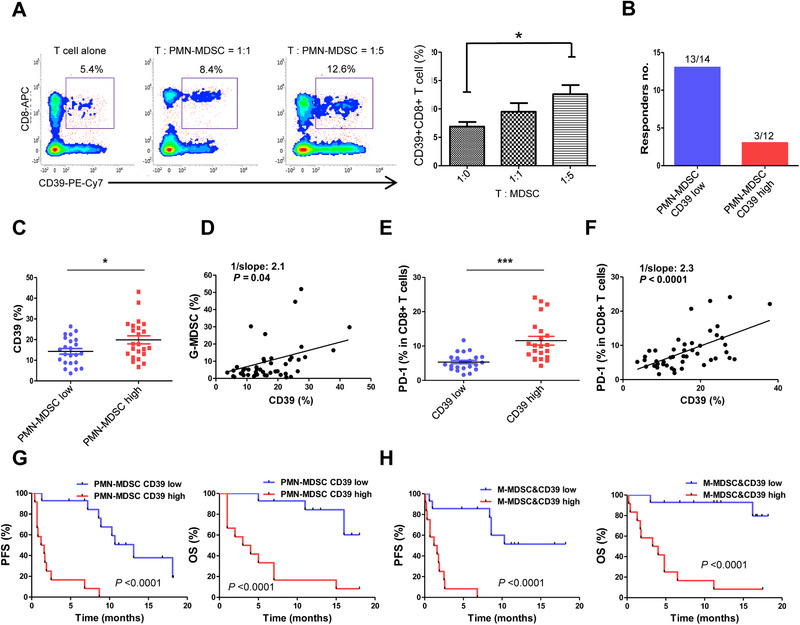
Figure 2.

The role of MDSCs and clinical outcomes depending on MDSCs and CD39+CD8+ T cells (validation cohort, n = 49). (A) PMN‐MDSCs from PBMCs sorted with CD15 microbead were cocultured with CD3+ T cells from the same patient and CD39 expression on CD8+ T cells was examined in T cell alone group and T:MDSC (1:1 and 1:5) ratios by flow cytometry (n = 8). Data are combined from four individual experiments with two patient samples per experiment. (B) The number of responders depending on both PMN‐MDSCs and CD39+ T cells low (13/14) and high group (3/12) of the patients (total n = 49). (C) CD39 expression on CD8+ T cells depending on PMN‐MDSCs low and high group measured by flow cytometry. (D) CD39+ T‐cells frequencies (%) correlation with PMN‐MDSCs frequencies (%). (E) PD‐1 expression depending on CD39+ T cells low and high group measured by flow cytometry. (F) Correlation coefficient of PD‐1 expression (%) and CD39+ T cells (%). PFS and OS of (G) PMN‐MDSCs and CD39+ T cells, and (H) M‐MDSCs and CD39+ T cells collectively low and high groups. All data were combined from five experiments with 9‐10 patient samples each time for validation cohort (n = 49) (C‐H). The error bar represents standard deviation of the mean (A). The center value is Mean ± SEM (C and E). For correlation coefficient, a linear regression model was used. Kaplan–Meier survival curves were plotted by median cutoff. Statistical significance was determined by log‐rank (Mantel–Cox) regression analysis, with the level of significance at p ⩽ 0.05. *, p ⩽ 0.05; **, p ⩽ 0.01; ***, p ⩽ 0.001 (Mann–Whitney U test).
