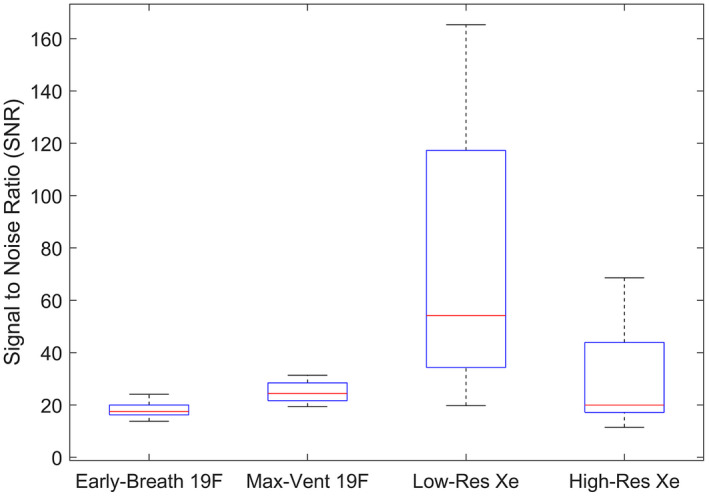
FIGURE 1.

Boxplot showing distribution of ventilation images SNRs across all ten subjects, with the median (red line), 25th and 75th percentiles (blue box edges), and range (whiskers) displayed. Statistically significant differences were seen in early‐breath 19F vs. low‐res 129Xe (P = .041) and early‐breath 19F vs. max‐vent 19F (P < .001)
