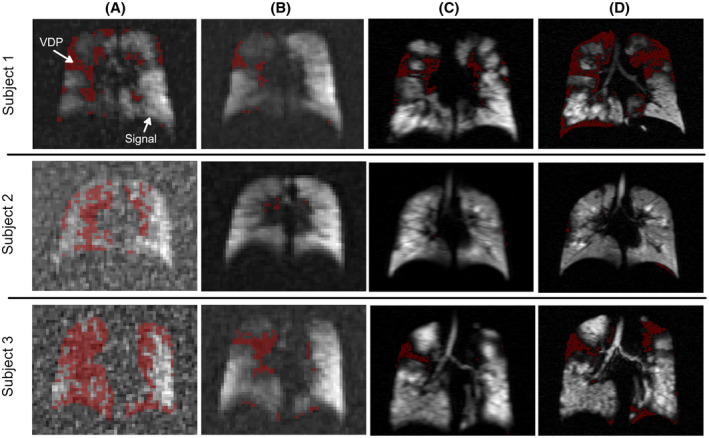
FIGURE 2.

Representative images showing early‐breath 19F (A), max‐vent 19F (B), low‐resolution 129Xe (C), and high‐resolution 129Xe (D) images in three subjects. A threshold was applied to define regions of ventilation defects (red masks). VDPs were calculated as the percentage of lung with a ventilation defect compared with total lung volume calculated by the anatomic mask. VDPs in early‐breath 19F images were higher than in max‐vent images, likely due to lack of sufficient signal. High‐resolution 129Xe images typically displayed higher VDPs than low‐res images
