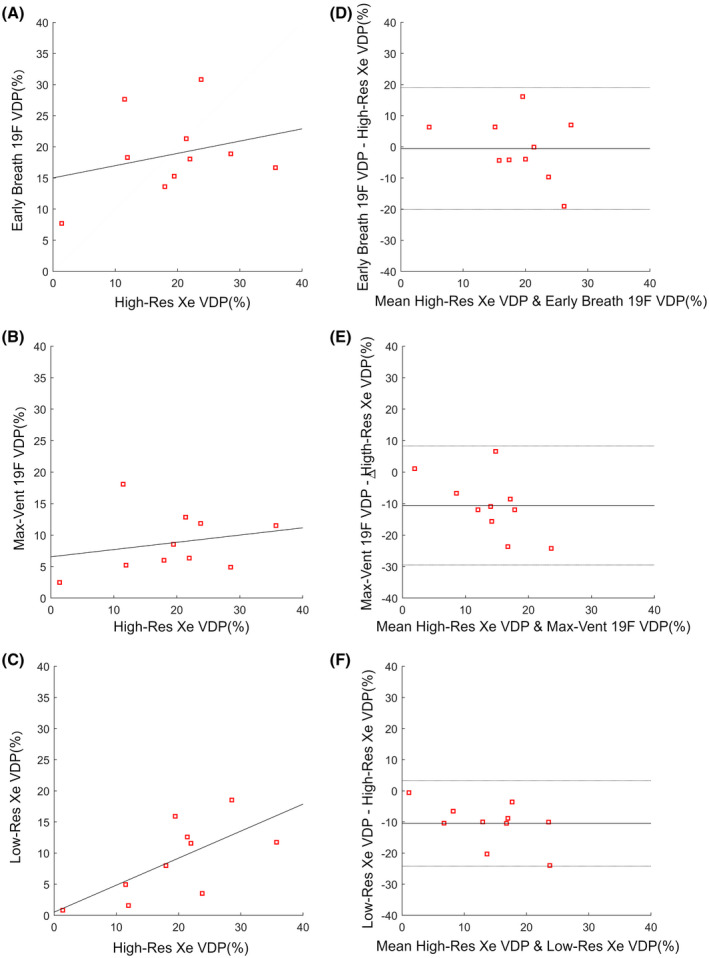
FIGURE 3.

Scatter (A, B, C) and Bland‐Altman (D, E, F) plots comparing VDP measurements. Regression line (dark gray) shown on scatter plots. Mean bias ± 95% lines of agreement shown on Bland‐Altman plots. High‐resolution 129Xe is compared with: early‐breath 19F images (r = 0.28, P = .43. Estimated bias = −0.5 ± 19.6%, P = .87) (A,D); (B, E). max‐vent 19F images (r = 0.23, P = .52. Estimated bias = −10.6 ± 18.9%, P = .007) (B,E); low‐resolution 129Xe (r = 0.68, P = .03 (C,F). Estimated bias = −10.5% ± 13.8%, P = .001)
