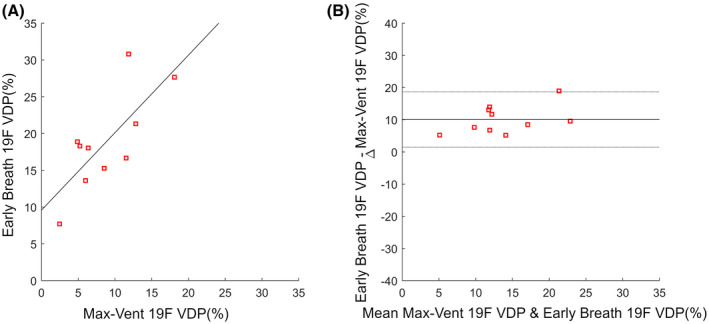
FIGURE 4.

Scatter plot (A) and Bland‐Altman plot (B) showing the comparison of VDP measurements from max‐vent 19F VDP and early‐breath 19F VDP. The correlation was r = 0.75, P = .01. The Bland‐Altman plot shows estimated bias = 10.05 ± 8.6% with P = 4.9e‐5
