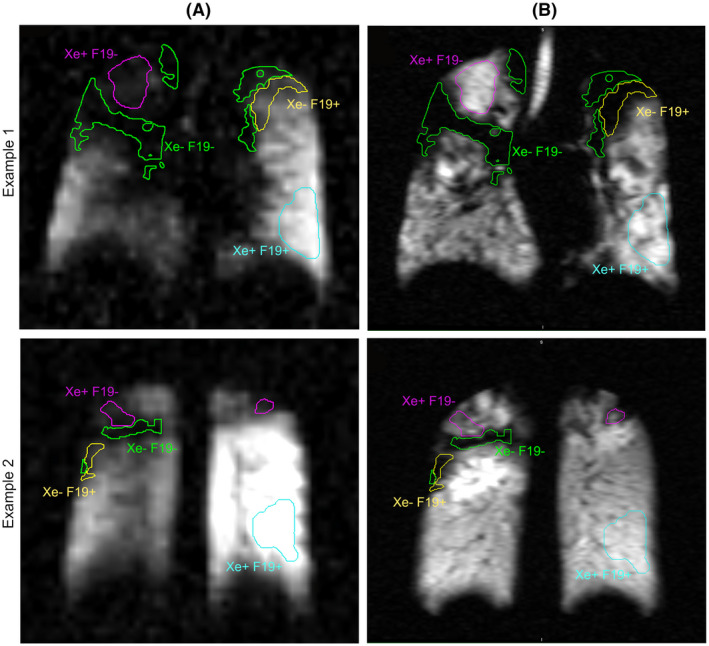
FIGURE 5.

Examples of mismatched ventilation signal from two subjects. A. max‐vent 19F and B. high‐resolution 123Xe images. The purple ROI outlines 129Xe + 19F‐ regions; the yellow ROI outlines 129Xe‐19F + regions; the cyan ROI outlines a matched 129Xe + 19F+ region used for comparison. The green ROI outlines a matched 129Xe‐19F‐ for additional comparison
