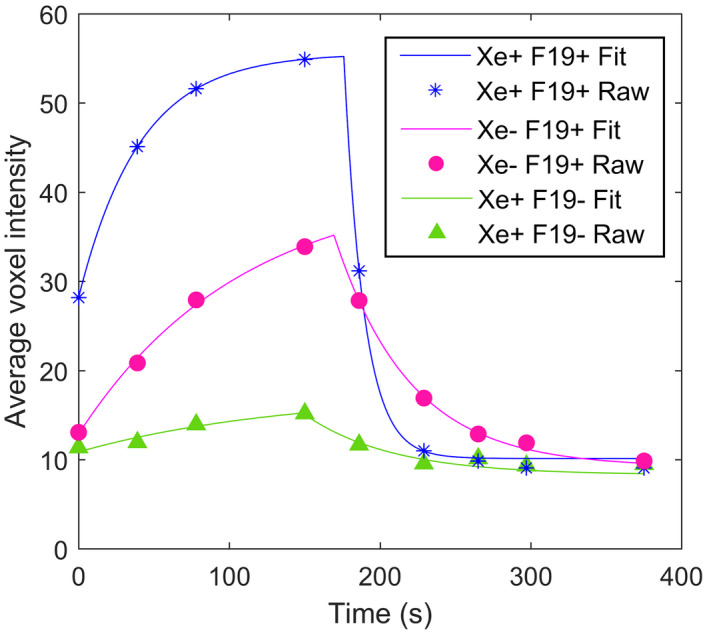
FIGURE 6.

Plots of the raw (symbols) and modeled (lines) 19F signal time course in matched (129Xe + 19F+; blue) and unmatched (129Xe‐19F + and 129Xe + 19F‐; red and green, respectively) ROIs from a single representative subject. In all subjects with mismatched ROIs, a consistent rank order of maximum gas 19F signal of 129Xe + 19F+> 129Xe‐19F+> 129Xe + 19F‐ was observed despite accentuated 129Xe signal (ie, higher than mean lung signal) in some of the 129Xe + 19F‐ ROIs.
