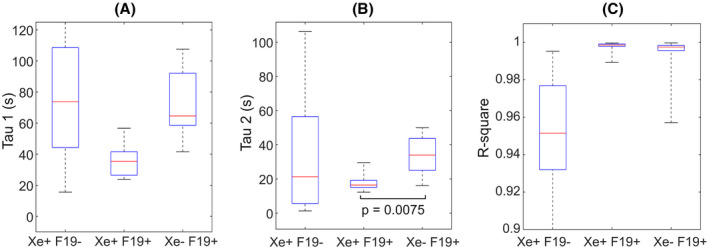
FIGURE 7.

Box plots of wash‐in (τ1) (A) and wash‐out (τ2) (B) time constants from the 19F bi‐exponential fit. c. R‐square indicates the goodness of the fit between raw data and modeled curves. The horizontal brackets indicate statistical significance with corresponding P‐values
