Fig 2.

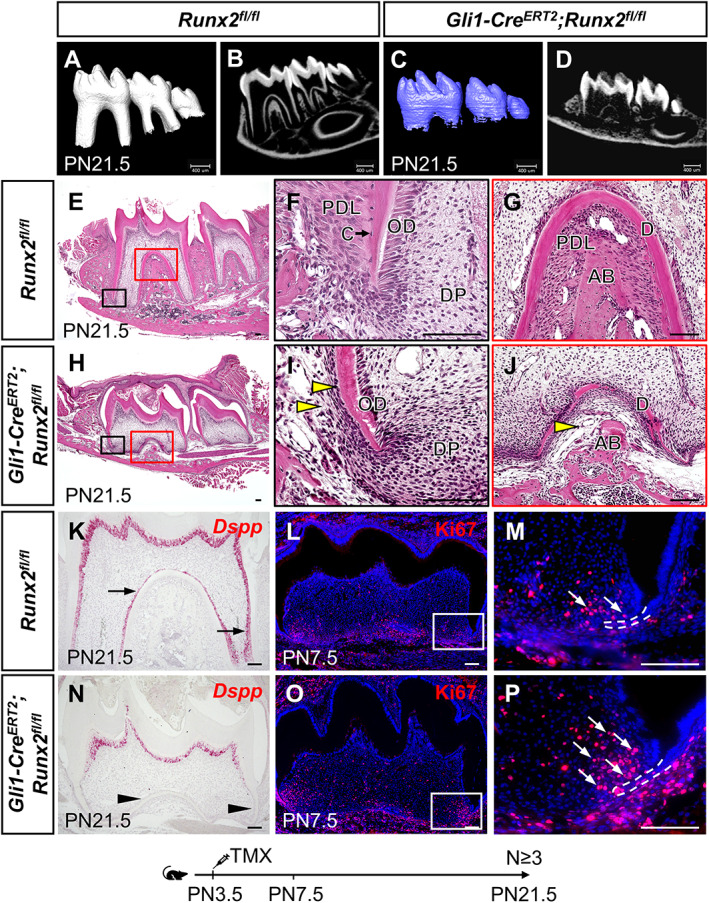
Loss of Runx2 in GLI1+ MSCs results in root development defects. (A–D) μCT images of Runx2 fl/fl control (A,B) and Gli1‐Cre ERT2 ;Runx2 fl/fl (C,D) mandibular molars at PN21.5. (E–J) H&E staining of Runx2 fl/fl control (E–G) and Gli1‐Cre ERT2 ;Runx2 fl/fl (H–J) mandibular molars at PN21.5. Boxed areas in E and H are shown magnified in F–G and I–J, respectively. Yellow arrowheads indicate the absence of cementoblasts and periodontal ligament. (K–P) Dspp in situ hybridization (red) at PN21.5 (K,N), and Ki67 immunofluorescence (red) indicating proliferating cells at PN7.5 (L,M,O,P) in sagittal sections of mandibular molars in Runx2 fl/fl control and Gli1‐Cre ERT2 ;Runx2 fl/fl mice. Arrows in K, M, and P indicate positive signals; arrowheads in N indicate absence of signal. Boxes in L and O are enlarged in M and P, respectively. Dashed white lines outline HERS. Scale bars in A–D = 400 μm; scale bars in all others = 100 μm. AB = alveolar bone; C = cementoblast; D = dentin; DP = dental pulp; OD = odontoblast; PDL = periodontal ligament.
