
FIGURE 2.
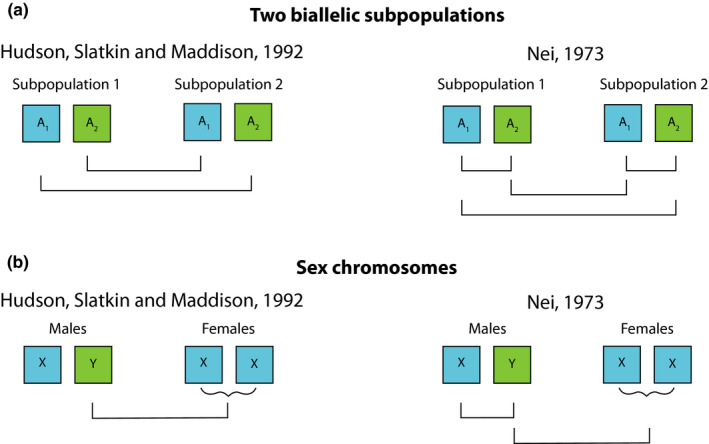
Comparison of the nonzero components of π B in Hudson, Slatkin, et al. (1992) estimator and π T in Nei’s (1973) estimator for biallelic SNPs in (a) two subpopulations and (b) an XY system. Each bar under the alleles represents a nonzero comparison that occurs in the formulation of π B or π T. The curly bracket beneath females in the sex chromosome comparison illustrates that females are homomorphic for this allele despite being diploid and thus only one nonzero comparison is made