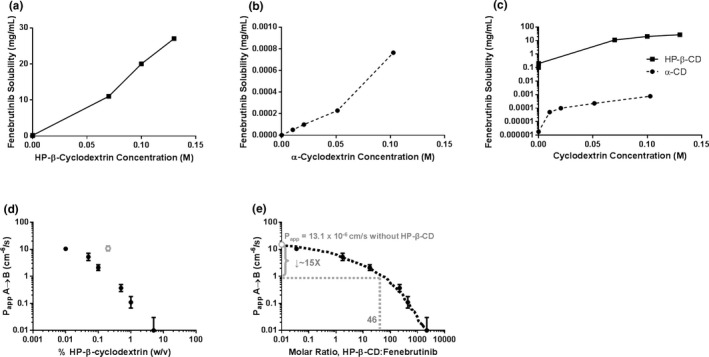
Figure 2.

The (a) k complex of fenebrutinib and HP‐β‐CD or (b) α‐CD was estimated by determining the solubility of fenebrutinib at different concentrations of cyclodextrin. (c) k complex of fenebrutinib with HP‐β‐CD was 45‐fold higher than that with α‐CD. (d) HP‐β‐CD reduces apparent apical‐to‐basolateral permeability of fenebrutinib across an MDCK cell monolayer in a concentration‐dependent manner. (e) Expressing HP‐β‐CD concentration as a molar ratio of HP‐β‐CD to fenebrutinib allows for the estimation of the change in permeability in the itraconazole DDI study. At an HP‐β‐CD:fenebrutinib ratio of 46, P app was expected to drop about 16‐fold. (n = 3. An outlier was removed, for analysis, shown in gray). α‐CD, α‐cyclodextrin; DDI, drug–drug interaction; HPβCD, hydroxypropyl‐β‐cyclodextrin; k complex, binding constant; MDCK, Madin‐Darby canine kidney cells; P app, apparent permeability; w/v, weight/volume.
