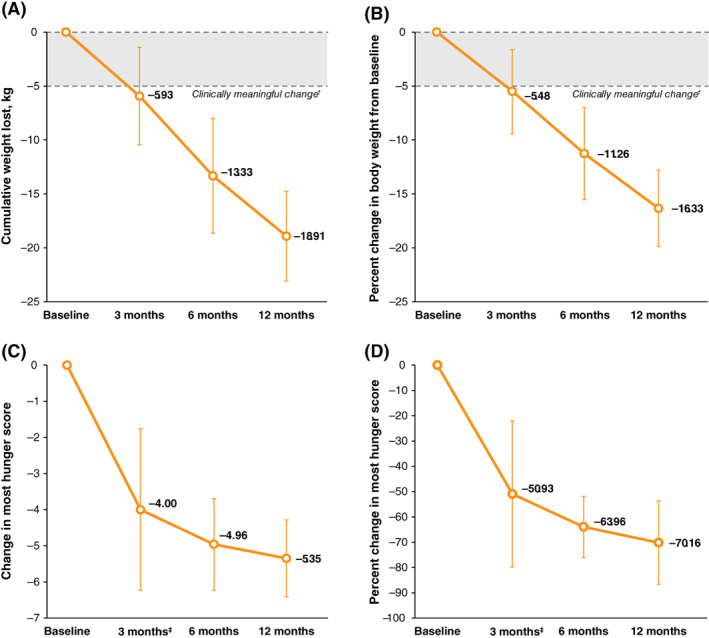
FIGURE 2.

Mean weight and hunger changes with setmelanotide treatment in the per‐protocol population. (A) Mean change from baseline in body weight at each visit over 1 year of setmelanotide treatment. (B) Percent change from baseline in mean body weight over 1 year of setmelanotide treatment. (C) Mean change from baseline in most hunger score at each visit over 1 year of setmelanotide treatment. (D) Percent change in mean most hunger score over 1 year of setmelanotide treatment. (A) and (B): N = 8; (C) and (D): N = 5. Error bars are the 90% confidence interval. †Clinically meaningful change defined as weight loss of ≥5 kg (or ≥5% in patients with baseline body weight <100 kg). ‡n = 6
