Figure 1.

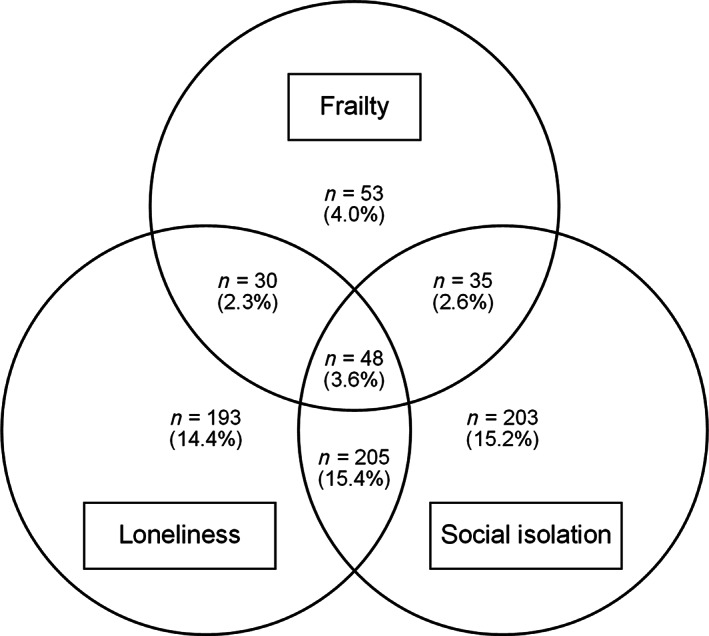
Venn diagram showing the overlap between frailty, loneliness, and social isolation. Note: There were also 566 respondents without any of the conditions (42.5% of the sample).

Venn diagram showing the overlap between frailty, loneliness, and social isolation. Note: There were also 566 respondents without any of the conditions (42.5% of the sample).