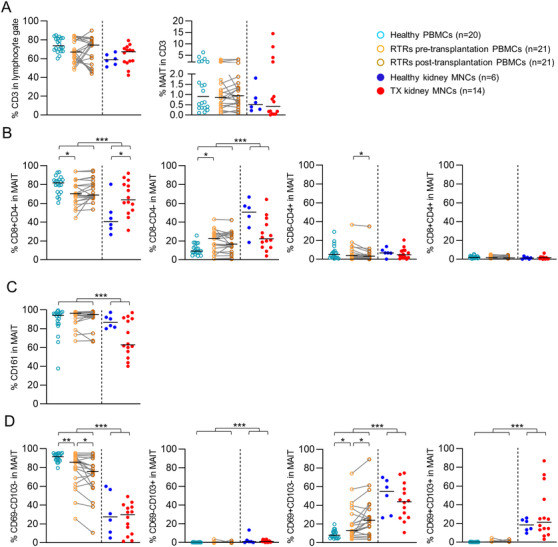
Figure 1.

MAIT cells in renal tissue constitute an equal share of the T‐cell population compared with those in circulation and display a tissue‐resident phenotype. (A) Scatterplots of the percentage of CD3+ cells in the lymphocyte gate and the percentage of MAIT cells within the CD3 population and scatterplots of the expression of (B) CD4 and CD8, (C) CD161, and (D) CD69 and/or CD103 on MAIT cells in healthy PBMCs, RTRs pretransplantation PBMCs, paired PBMCs post‐transplantation, healthy kidney MNCs, and TX kidney MNCs. The following statistical comparisons were made: kidney MNCs (both healthy and TX) versus PBMCs (healthy and RTRs post‐transplantation) (Mann Whitney U‐test); healthy kidney versus TX kidney MNCs (Mann Whitney U‐test); RTRs pretransplantation versus healthy PBMCs (Mann Whitney U‐test); RTRs pre‐ versus post‐transplantation PBMCs (Wilcoxon signed rank test). The horizontal dash represents the median. Only significant p‐values are displayed: *p < 0.05, **p ≤ 0.01, ***p ≤ 0.001. Data shown represent nine flow cytometry experiments with n = 2, 4, 9, 2, 21, 10, 16, 15, and 12 donors. Data from 82 unique individuals are shown. RTRs: renal transplant recipients; PBMCs: peripheral blood mononuclear cells; MNCs: mononuclear cells; TX: transplant.
