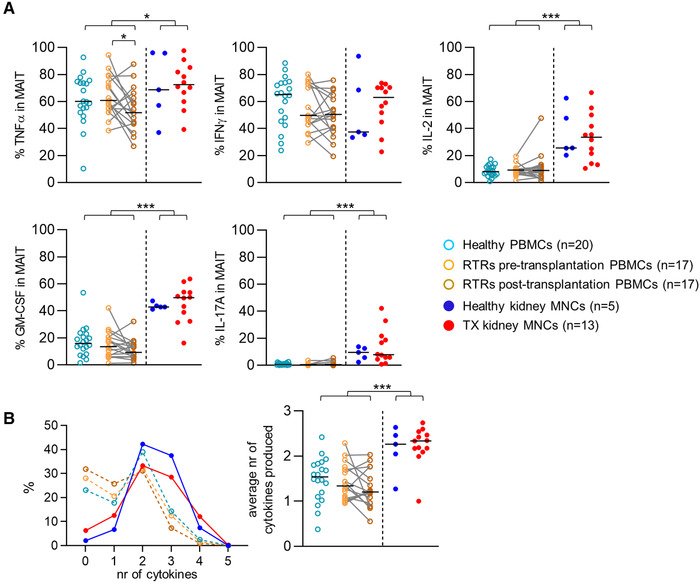
Figure 5.

MAIT cells in renal tissue are more often polyfunctional after stimulation with PMA‐ionomycin than circulating MAIT cells. (A) Scatterplots of the percentage of TNFα‐, IFNү‐, IL‐2‐, GM‐CSF‐, or IL‐17A‐producing MAIT cells from healthy PBMCs, RTRs pretransplantation PBMCs, paired PBMCs post‐transplantation, healthy kidney MNCs, and TX kidney MNCs after stimulation with PMA and Ionomycin. (B) Graph of the median percentage of MAIT cells (Y‐axis) producing the stated number of cytokines (X‐axis) and scatterplot of the average number of cytokines produced by MAIT cells from healthy PBMCs, RTRs pretransplantation PBMCs, paired PBMCs post‐transplantation, healthy kidney MNCs and TX kidney MNCs after stimulation with PMA and Ionomycin. The following statistical comparisons were made: kidney MNCs (both healthy and TX) versus PBMCs (healthy and RTRs post‐transplantation) (Mann Whitney U‐test); healthy kidney versus TX kidney MNCs (Mann Whitney U‐test); RTRs pretransplantation versus healthy PBMCs (Mann Whitney U‐test); RTRs pre‐ versus post‐transplantation PBMCs (Wilcoxon signed rank test). The horizontal dash represents the median. Only significant p‐values are displayed: *p < 0.05, **p ≤ 0.01, ***p ≤ 0.001. RTRs: renal transplant recipients; PBMCs: peripheral blood mononuclear cells; MNCs: mononuclear cells, TX: transplant. Data shown are representative of eight independent flow cytometry experiments with n = 3, 8, 9, 10, 12, 12, 7, and 12 individuals per experiment. A total of 72 unique individuals are shown.
